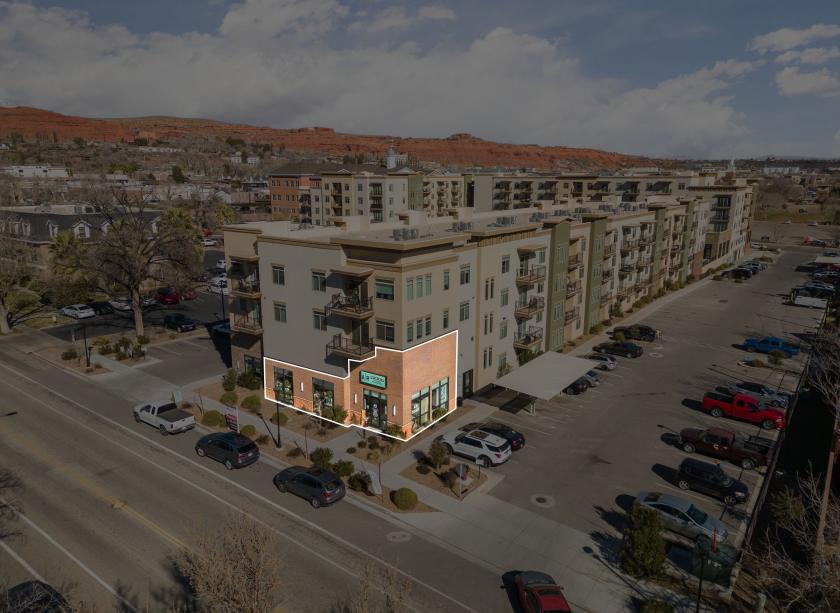
1-Mile | 3-Miles | 5-Miles | ||
---|---|---|---|---|
Total Population | 5,668 | 47,246 | 90,069 | |
Population Median Age | 38 | 40 | 39 | |
Population by Age | 0-9 Yrs | 647 (11%) | 5989 (12%) | 12196 (13%) |
10-19 Yrs | 624 (11%) | 6353 (13%) | 13089 (14%) | |
20-29 Yrs | 1364 (24%) | 8107 (17%) | 12467 (13%) | |
30-39 Yrs | 681 (12%) | 5051 (10%) | 9624 (10%) | |
40-49 Yrs | 497 (8%) | 4561 (9%) | 9635 (10%) | |
50-59 Yrs | 560 (9%) | 4097 (8%) | 8495 (9%) | |
60-69 Yrs | 541 (9%) | 5128 (10%) | 10339 (11%) | |
70+ Yrs | 756 (13%) | 7962 (16%) | 14225 (15%) | |
Median HH Income | $42,113 | $55,541 | $60,592 | |
Total Household Income | < 24K | 518 (24%) | 3166 (18%) | 5230 (16%) |
25-49K | 721 (33%) | 4630 (26%) | 7691 (24%) | |
50-74K | 443 (20%) | 4105 (23%) | 6611 (20%) | |
75-99K | 222 (10%) | 2304 (13%) | 4096 (12%) | |
100-199K | 204 (9%) | 2780 (15%) | 6769 (21%) | |
200K+ | 39 (1%) | 553 (3%) | 1619 (5%) | |
Highest Education Level | No Diploma | 501 | 2086 | 3826 |
Diploma or GED | 972 | 7146 | 12357 | |
Some College | 854 | 8904 | 16563 | |
Assoc. Degree | 437 | 4183 | 8003 | |
Bachelors Degree | 617 | 4943 | 10979 | |
Higher Degree | 272 | 3079 | 6671 | |
Total Housing Units | 2,456 | 20,835 | 38,155 | |
--Owner-Occupied | 964 | 9,866 | 20,404 | |
--Renter-Occupied | 1,183 | 7,673 | 11,613 | |
Owner-Occupied Values | < 100K | 78 | 616 | 1030 |
100-199K | 329 | 1838 | 2734 | |
200-299K | 391 | 3661 | 6735 | |
300-399K | 81 | 2099 | 4762 | |
400-499K | 42 | 786 | 2491 | |
500K+ | 43 | 865 | 2653 | |
Total Working Age Population | 4,720 | 37,865 | 70,580 | |
In Work Force | 2,931 | 21,784 | 40,892 | |
Not In Work Force | 1,789 | 16,081 | 29,688 | |
Workforce Employed | 2,819 | 20,833 | 39,441 | |
Workforce Unemployed | 111 | 948 | 1,448 | |
Civlian Workforce | 2,930 | 21,781 | 40,889 | |
Military Workforce | 1 | 3 | 3 | |
Total Households | 2,147 | 17,538 | 32,017 | |
Family Households | 1,325 | 11,940 | 23,440 | |
Non-Family Households | 822 | 5,598 | 8,577 | |
Married Couple | 1,034 | 9,547 | 19,000 | |
Other Family | 290 | 2,394 | 4,440 | |
Married w/Child | 391 | 3,383 | 7,184 | |
Single Male w/Child | 29 | 130 | 380 | |
Single Female w/Child | 126 | 1,122 | 1,979 |
Population Change Last Two Decades - Plus Projection
2000 | % | 2010 | % | 2020 | % | 2030 | |
---|---|---|---|---|---|---|---|
Utah | 2,233,169 | +24 | 2,763,885 | +20 | 3,325,425 | +17 | 3,889,310 |
Washington County | 90,354 | +53 | 138,115 | +35 | 186,618 | +35 | 251,636 |
Total Working Age Population:
Total Households:
Total Working Age Population:
Total Households:
Total Working Age Population:
Total Households: