Specialty Real Estate
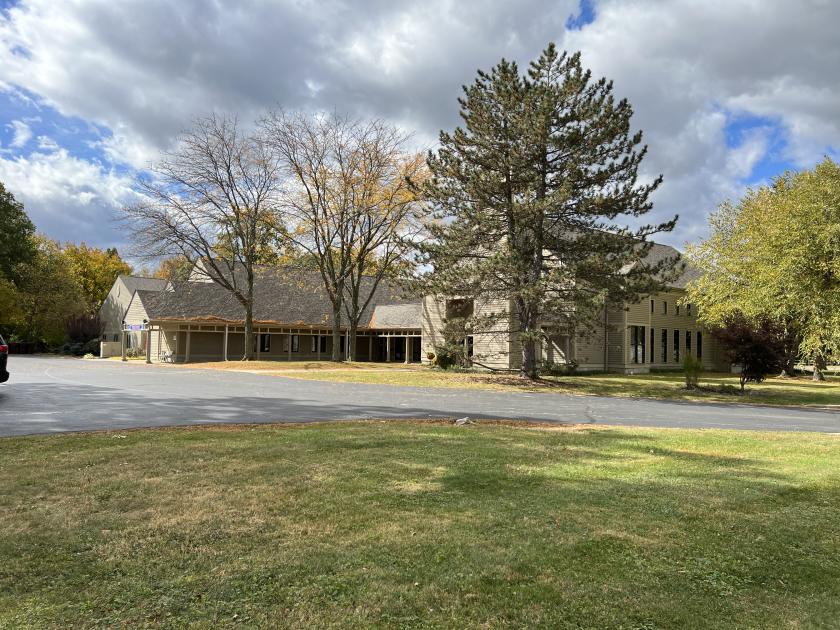
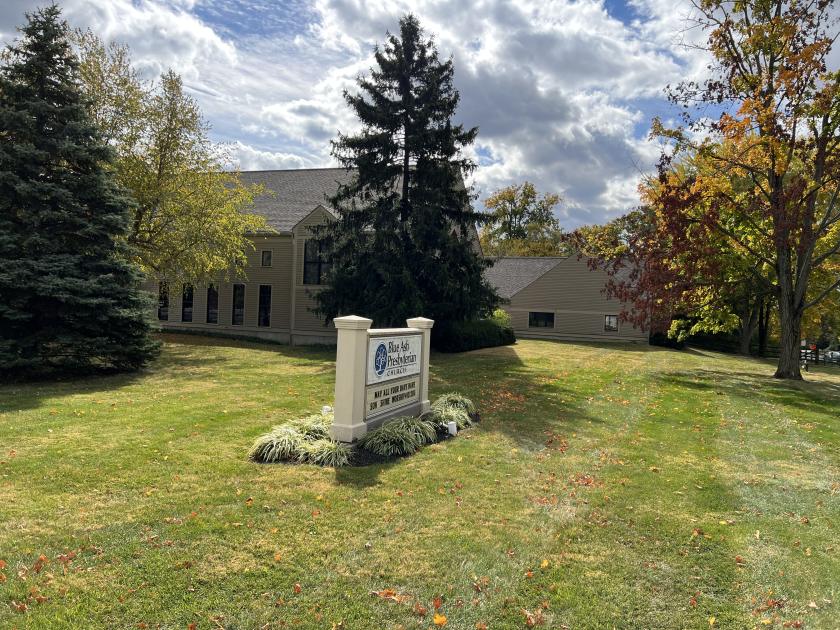
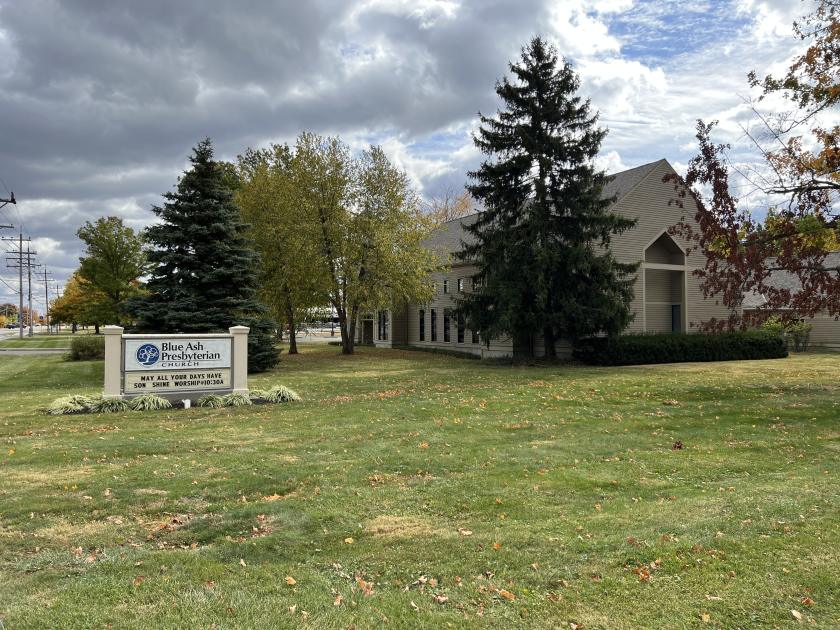
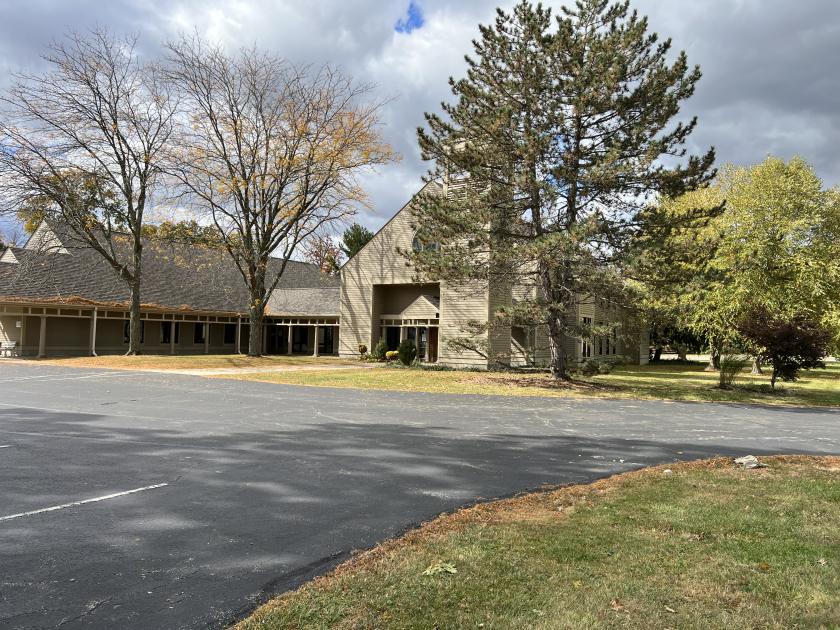
4309 Cooper Road Cincinnati, OH 45242
4309 Cooper Road Cincinnati, OH 45242

Details & Description
Property Highlights
- • Ideal Location
- • Investment or Owner/User Opportunity
- • High Daytime Population
Additional Photos


Listing Agents

Laurence Bergman
O: 513-322-6307
M: 513-515-5488
larry@bergmancommercial.com
O: 513-322-6307
M: 513-515-5488
larry@bergmancommercial.com
While we strive to provide the most accurate information, all listing information, and demographic data, is provided by third-parties. As such, MyEListing will not be responsible for the accuracy of the information. It is strongly recommended that you verify all information with the listing agent, and any relevant agencies, prior to making any decisions.