Flex-Office-Warehouse
1 West Interstate Street Bedford, OH 44146
1 West Interstate Street Bedford, OH 44146

Details & Description
Property Highlights
• Building 2: 6,000 SF to 14,000 SF
• Building 2: 6,000 SF to 14,000 SF
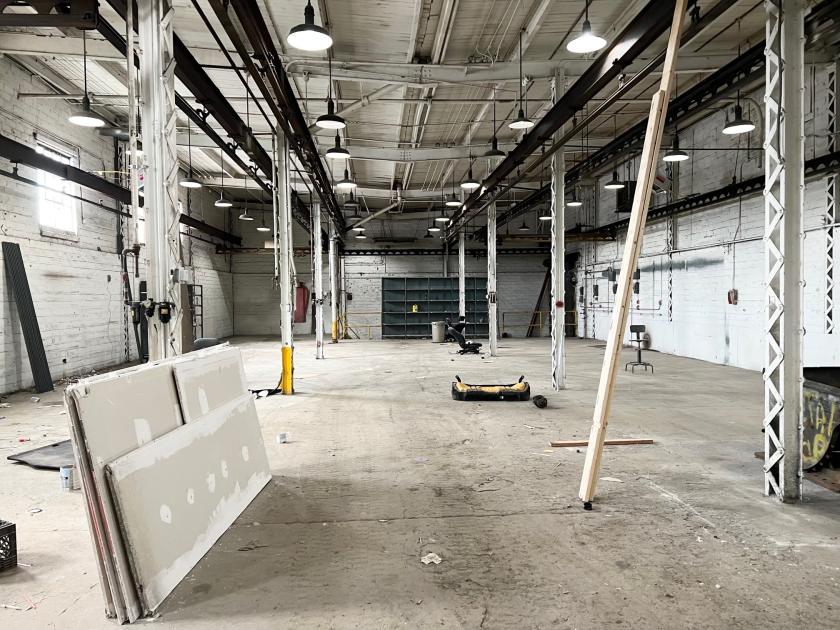
Additional Photos


Listing Agents

Jeffrey A. Calig
O: 216-455-0910
M: 216-496-3143
jcalig@naipvc.com
O: 216-455-0910
M: 216-496-3143
jcalig@naipvc.com

David Hexter
O: 216-455-0890
M: 216-469-6979
dhexter@naipvc.com
O: 216-455-0890
M: 216-469-6979
dhexter@naipvc.com
While we strive to provide the most accurate information, all listing information, and demographic data, is provided by third-parties. As such, MyEListing will not be responsible for the accuracy of the information. It is strongly recommended that you verify all information with the listing agent, and any relevant agencies, prior to making any decisions.


