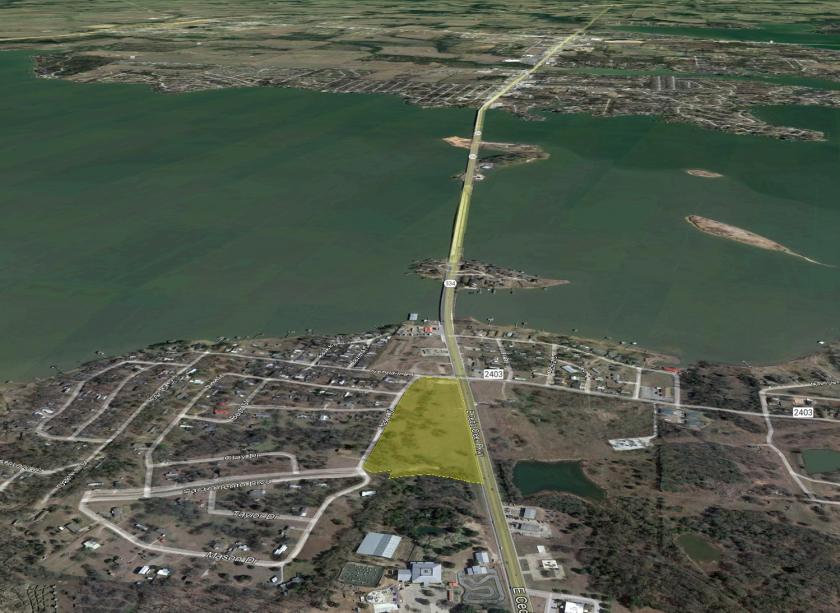
1-Mile | 3-Miles | 5-Miles | ||
---|---|---|---|---|
Total Population | 610 | 6,168 | 14,912 | |
Population Median Age | 45 | 45 | 45 | |
Population by Age | 0-9 Yrs | 75 (12%) | 545 (8%) | 1177 (7%) |
10-19 Yrs | 51 (8%) | 735 (11%) | 1665 (11%) | |
20-29 Yrs | 51 (8%) | 567 (9%) | 1646 (11%) | |
30-39 Yrs | 79 (12%) | 739 (11%) | 1638 (10%) | |
40-49 Yrs | 58 (9%) | 633 (10%) | 1781 (11%) | |
50-59 Yrs | 73 (11%) | 771 (12%) | 2010 (13%) | |
60-69 Yrs | 112 (18%) | 955 (15%) | 2399 (16%) | |
70+ Yrs | 110 (18%) | 1223 (19%) | 2596 (17%) | |
Median HH Income | $45,173 | $47,018 | $49,590 | |
Total Household Income | < 24K | 67 (25%) | 635 (23%) | 1380 (21%) |
25-49K | 98 (36%) | 848 (31%) | 1810 (28%) | |
50-74K | 55 (20%) | 541 (20%) | 1212 (19%) | |
75-99K | 17 (6%) | 224 (8%) | 777 (12%) | |
100-199K | 24 (8%) | 332 (12%) | 882 (13%) | |
200K+ | 6 (2%) | 119 (4%) | 264 (4%) | |
Highest Education Level | No Diploma | 97 | 644 | 1797 |
Diploma or GED | 172 | 1673 | 3911 | |
Some College | 100 | 1218 | 2900 | |
Assoc. Degree | 44 | 466 | 990 | |
Bachelors Degree | 27 | 359 | 968 | |
Higher Degree | 22 | 229 | 637 | |
Total Housing Units | 366 | 3,577 | 8,383 | |
--Owner-Occupied | 221 | 2,222 | 4,914 | |
--Renter-Occupied | 47 | 477 | 1,411 | |
Owner-Occupied Values | < 100K | 117 | 950 | 1945 |
100-199K | 71 | 730 | 1517 | |
200-299K | 17 | 263 | 741 | |
300-399K | 8 | 81 | 257 | |
400-499K | 3 | 91 | 180 | |
500K+ | 4 | 107 | 273 | |
Total Working Age Population | 499 | 5,146 | 12,659 | |
In Work Force | 236 | 2,324 | 6,516 | |
Not In Work Force | 262 | 2,822 | 6,143 | |
Workforce Employed | 215 | 2,128 | 6,042 | |
Workforce Unemployed | 22 | 196 | 474 | |
Civlian Workforce | 236 | 2,324 | 6,516 | |
Military Workforce | 0 | 0 | 0 | |
Total Households | 268 | 2,699 | 6,325 | |
Family Households | 177 | 1,716 | 4,064 | |
Non-Family Households | 91 | 982 | 2,261 | |
Married Couple | 136 | 1,371 | 3,140 | |
Other Family | 40 | 345 | 925 | |
Married w/Child | 35 | 333 | 653 | |
Single Male w/Child | 6 | 40 | 66 | |
Single Female w/Child | 3 | 74 | 318 |
Population Change Last Two Decades - Plus Projection
2000 | % | 2010 | % | 2020 | % | 2030 | |
---|---|---|---|---|---|---|---|
Texas | 20,851,820 | +21 | 25,145,561 | +18 | 29,677,668 | +18 | 34,894,452 |
Henderson County | 73,277 | +7 | 78,532 | +3 | 81,179 | +1 | 82,001 |
Kaufman County | 71,313 | +45 | 103,350 | +21 | 125,134 | +22 | 152,682 |
Total Working Age Population:
Total Households:
Total Working Age Population:
Total Households:
Total Working Age Population:
Total Households: