Retail Space
10235 North Metro Parkway East Phoenix, AZ 85051
10235 North Metro Parkway East Phoenix, AZ 85051
Details & Description
Property Highlights
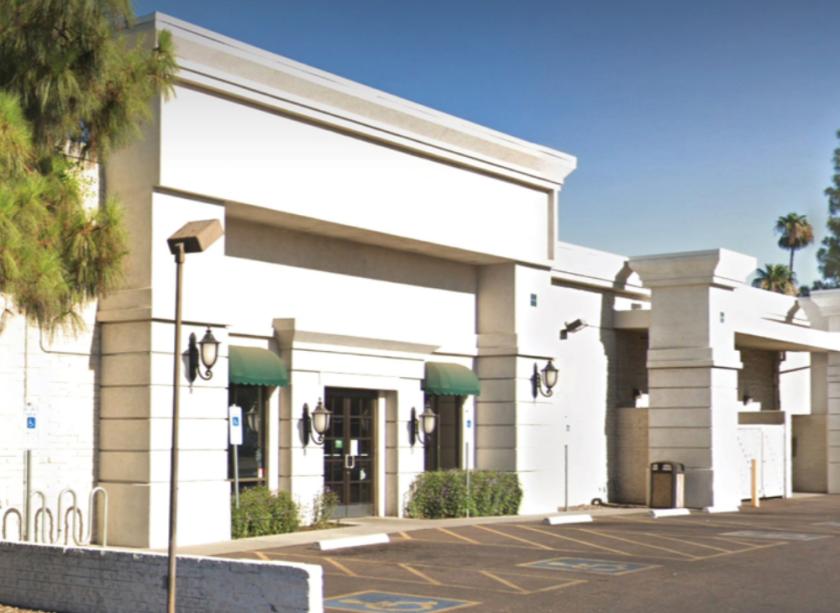
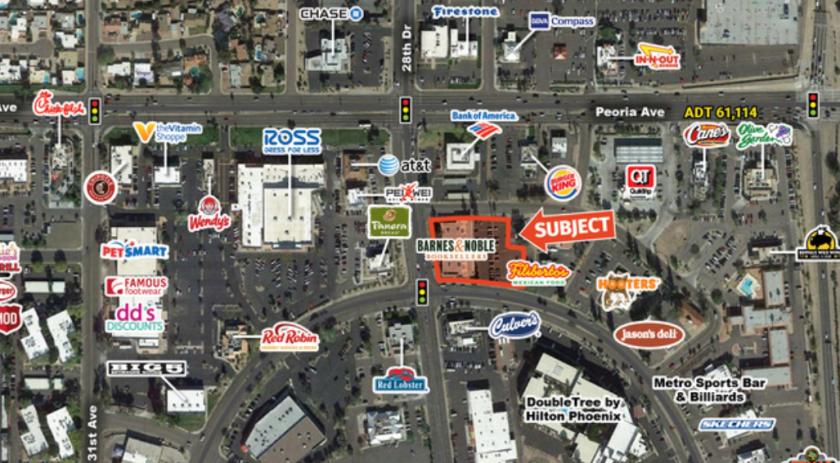
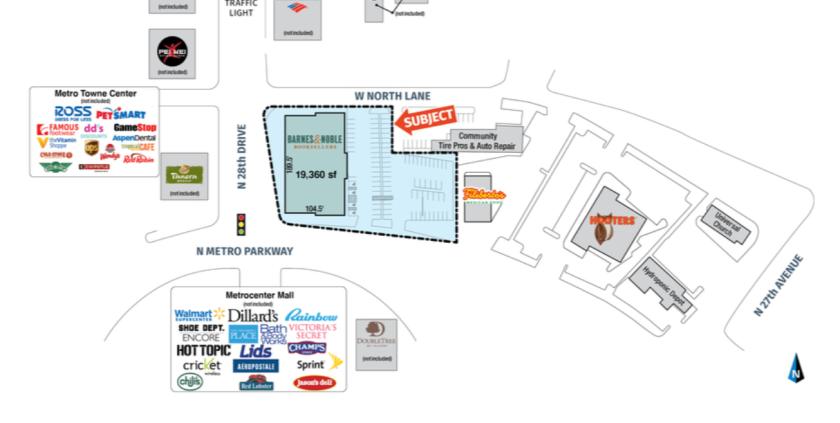
- • Former Barnes & Noble at Metro Towne Center
- • Good visibility to Peoria Ave (57,840 cpd)
- • Can accommodate retail medical and office users
Additional Photos

Listing Agents

Chris Stamets
O: 602-778-3748
cstamets@w-retail.com
O: 602-778-3748
cstamets@w-retail.com

Neil Board
O: 602-778-3781
nboard@w-retail.com
O: 602-778-3781
nboard@w-retail.com
While we strive to provide the most accurate information, all listing information, and demographic data, is provided by third-parties. As such, MyEListing will not be responsible for the accuracy of the information. It is strongly recommended that you verify all information with the listing agent, and any relevant agencies, prior to making any decisions.


