Retail Space
1050 East Pecos Road Chandler, AZ 85225
1050 East Pecos Road Chandler, AZ 85225
Details & Description
Property Highlights
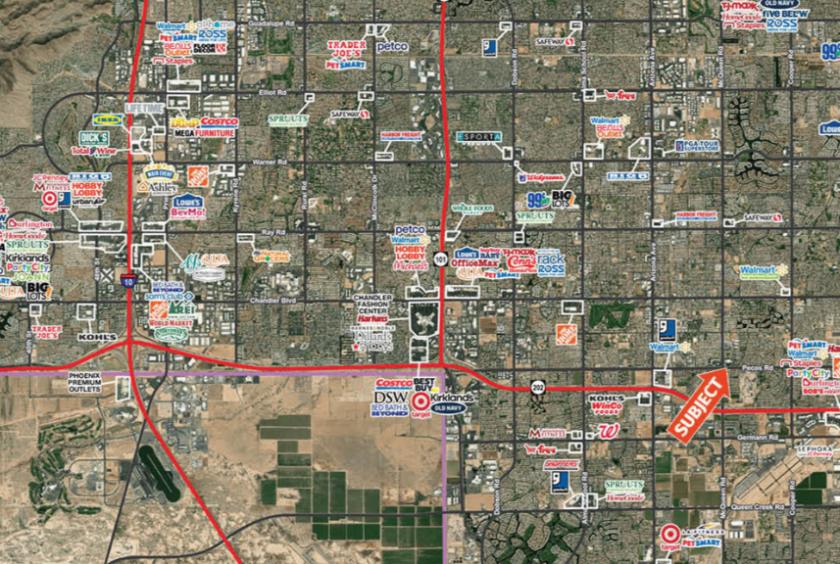
• Great access and exposure to the Loop 202 Fwy., ¼ mile to the North
• Over $100,000 average household income in a 5 mile radius
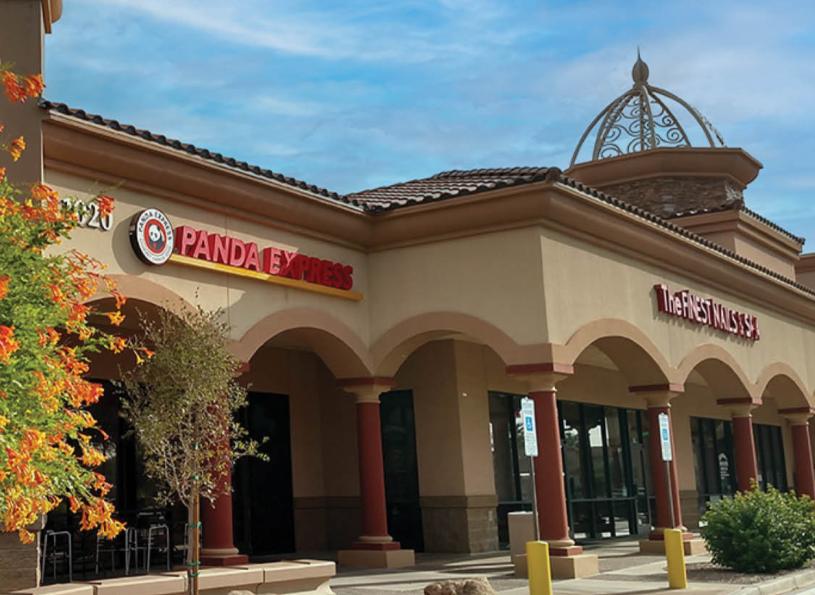
Additional Photos

Listing Agents

Jason Fessinger
O: 602-368-1090
jfessinger@w-retail.com
O: 602-368-1090
jfessinger@w-retail.com

Kalen Rickard
O: 602-931-4492
krickard@w-retail.com
O: 602-931-4492
krickard@w-retail.com

Jake McClaughry
O: 602-368-1088
jmcclaughry@w-retail.com
O: 602-368-1088
jmcclaughry@w-retail.com
While we strive to provide the most accurate information, all listing information, and demographic data, is provided by third-parties. As such, MyEListing will not be responsible for the accuracy of the information. It is strongly recommended that you verify all information with the listing agent, and any relevant agencies, prior to making any decisions.


