Retail Space
118 Soledad Street San Antonio, TX 78205
118 Soledad Street San Antonio, TX 78205
Details & Description
Property Highlights
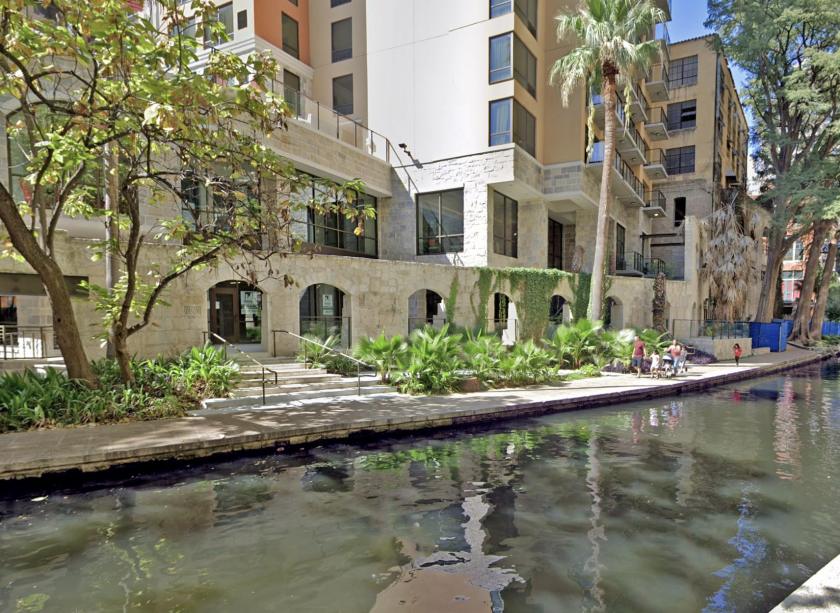
• Close proximity to the Tobin Center for Performing Arts, Alamo Plaza, The Riverwalk & other major Downtown attract
• Surrounded by multiple office buildings, hotels, and apartment buildings
Additional Photos


Listing Agents

Amanda Powell
O: 210-222-2424
M: 281-733-9545
anelson@dhrp.us
O: 210-222-2424
M: 281-733-9545
anelson@dhrp.us
While we strive to provide the most accurate information, all listing information, and demographic data, is provided by third-parties. As such, MyEListing will not be responsible for the accuracy of the information. It is strongly recommended that you verify all information with the listing agent, and any relevant agencies, prior to making any decisions.


