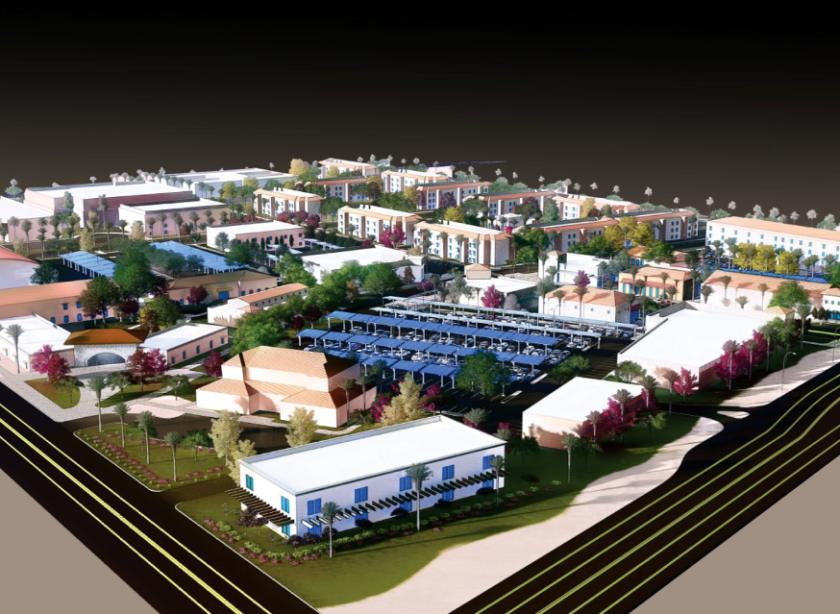
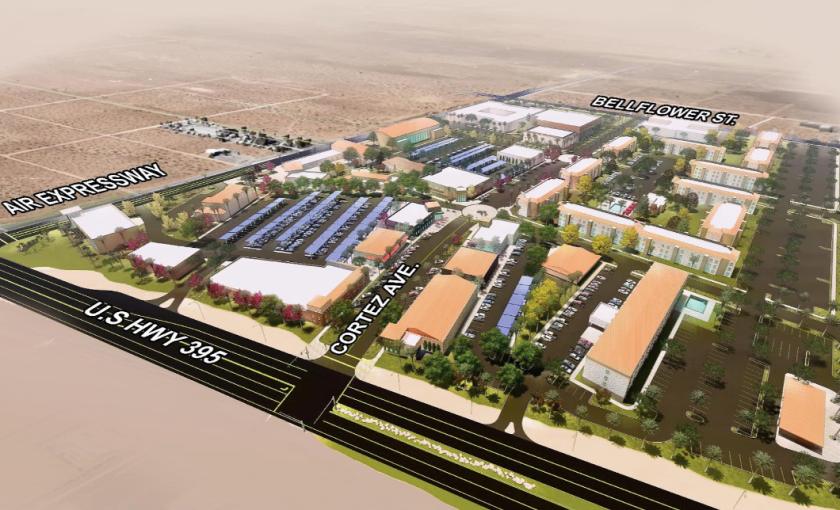
1-Mile | 3-Miles | 5-Miles | ||
---|---|---|---|---|
Total Population | 2,978 | 15,143 | 49,022 | |
Population Median Age | 29 | 31 | 31 | |
Population by Age | 0-9 Yrs | 555 (18%) | 2407 (15%) | 8711 (17%) |
10-19 Yrs | 619 (20%) | 2784 (18%) | 8851 (18%) | |
20-29 Yrs | 525 (17%) | 2470 (16%) | 6535 (13%) | |
30-39 Yrs | 306 (10%) | 2334 (15%) | 8332 (16%) | |
40-49 Yrs | 439 (14%) | 2065 (13%) | 6416 (13%) | |
50-59 Yrs | 240 (8%) | 1553 (10%) | 5350 (10%) | |
60-69 Yrs | 210 (7%) | 1048 (6%) | 3050 (6%) | |
70+ Yrs | 84 (2%) | 481 (3%) | 1776 (3%) | |
Median HH Income | $29,813 | $40,840 | $57,943 | |
Total Household Income | < 24K | 292 (40%) | 1141 (34%) | 2375 (21%) |
25-49K | 201 (27%) | 822 (24%) | 2820 (25%) | |
50-74K | 106 (14%) | 529 (15%) | 2034 (18%) | |
75-99K | 89 (12%) | 429 (12%) | 1633 (14%) | |
100-199K | 17 (2%) | 247 (7%) | 1999 (17%) | |
200K+ | 15 (2%) | 170 (5%) | 343 (3%) | |
Highest Education Level | No Diploma | 679 | 2899 | 7293 |
Diploma or GED | 357 | 2760 | 9054 | |
Some College | 320 | 1997 | 7197 | |
Assoc. Degree | 105 | 829 | 2049 | |
Bachelors Degree | 66 | 318 | 1480 | |
Higher Degree | 10 | 112 | 1069 | |
Total Housing Units | 910 | 3,929 | 12,127 | |
--Owner-Occupied | 183 | 1,501 | 6,827 | |
--Renter-Occupied | 536 | 1,838 | 4,378 | |
Owner-Occupied Values | < 100K | 103 | 402 | 607 |
100-199K | 53 | 506 | 1535 | |
200-299K | 23 | 522 | 3704 | |
300-399K | 4 | 51 | 781 | |
400-499K | 0 | 16 | 38 | |
500K+ | 0 | 4 | 162 | |
Total Working Age Population | 2,053 | 11,056 | 34,813 | |
In Work Force | 1,185 | 4,963 | 17,625 | |
Not In Work Force | 868 | 6,093 | 17,188 | |
Workforce Employed | 993 | 4,210 | 15,507 | |
Workforce Unemployed | 192 | 752 | 2,083 | |
Civlian Workforce | 1,185 | 4,963 | 17,590 | |
Military Workforce | 0 | 0 | 35 | |
Total Households | 719 | 3,339 | 11,205 | |
Family Households | 620 | 2,750 | 9,323 | |
Non-Family Households | 99 | 589 | 1,882 | |
Married Couple | 295 | 1,293 | 5,806 | |
Other Family | 324 | 1,457 | 3,517 | |
Married w/Child | 122 | 670 | 3,052 | |
Single Male w/Child | 37 | 195 | 387 | |
Single Female w/Child | 195 | 664 | 1,455 |
Population Change Last Two Decades - Plus Projection
2000 | % | 2010 | % | 2020 | % | 2030 | |
---|---|---|---|---|---|---|---|
California | 33,871,648 | +10 | 37,253,956 | +9 | 40,467,295 | +8 | 43,631,295 |
San Bernardino County | 1,709,434 | +19 | 2,035,210 | +9 | 2,223,189 | +11 | 2,468,202 |
Total Working Age Population:
Total Households:
Total Working Age Population:
Total Households:
Total Working Age Population:
Total Households: