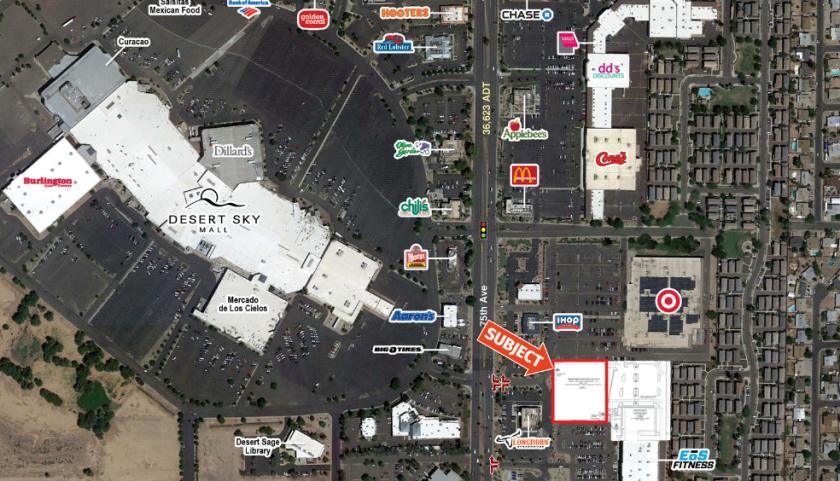
1-Mile | 3-Miles | 5-Miles | ||
---|---|---|---|---|
Total Population | 25,270 | 183,688 | 414,633 | |
Population Median Age | 29 | 31 | 31 | |
Population by Age | 0-9 Yrs | 4159 (16%) | 31055 (16%) | 72898 (17%) |
10-19 Yrs | 4886 (19%) | 34516 (18%) | 74673 (18%) | |
20-29 Yrs | 5456 (21%) | 32485 (17%) | 68957 (16%) | |
30-39 Yrs | 3341 (13%) | 26517 (14%) | 59020 (14%) | |
40-49 Yrs | 2996 (11%) | 22863 (12%) | 52630 (12%) | |
50-59 Yrs | 2216 (8%) | 17413 (9%) | 41759 (10%) | |
60-69 Yrs | 1526 (6%) | 10897 (5%) | 26296 (6%) | |
70+ Yrs | 689 (2%) | 7941 (4%) | 18399 (4%) | |
Median HH Income | $48,560 | $49,963 | $51,700 | |
Total Household Income | < 24K | 991 (14%) | 7960 (16%) | 21257 (19%) |
25-49K | 2423 (36%) | 15739 (33%) | 32418 (29%) | |
50-74K | 1875 (28%) | 10840 (22%) | 23598 (21%) | |
75-99K | 663 (10%) | 6047 (12%) | 15096 (13%) | |
100-199K | 578 (8%) | 5887 (12%) | 16597 (14%) | |
200K+ | 84 (1%) | 883 (1%) | 2046 (1%) | |
Highest Education Level | No Diploma | 4697 | 35648 | 74804 |
Diploma or GED | 4270 | 32360 | 73407 | |
Some College | 2234 | 18511 | 44896 | |
Assoc. Degree | 1109 | 5896 | 15351 | |
Bachelors Degree | 664 | 5584 | 15920 | |
Higher Degree | 370 | 2822 | 7237 | |
Total Housing Units | 6,975 | 49,495 | 116,799 | |
--Owner-Occupied | 2,970 | 24,709 | 58,156 | |
--Renter-Occupied | 3,644 | 22,646 | 52,857 | |
Owner-Occupied Values | < 100K | 301 | 3302 | 7645 |
100-199K | 1984 | 14321 | 28142 | |
200-299K | 643 | 6119 | 18020 | |
300-399K | 6 | 498 | 2803 | |
400-499K | 5 | 211 | 666 | |
500K+ | 31 | 258 | 879 | |
Total Working Age Population | 18,565 | 132,193 | 297,025 | |
In Work Force | 12,050 | 88,844 | 197,894 | |
Not In Work Force | 6,516 | 43,349 | 99,131 | |
Workforce Employed | 11,213 | 82,824 | 184,681 | |
Workforce Unemployed | 796 | 5,903 | 12,714 | |
Civlian Workforce | 12,009 | 88,728 | 197,396 | |
Military Workforce | 41 | 116 | 499 | |
Total Households | 6,615 | 47,355 | 111,013 | |
Family Households | 5,011 | 38,096 | 85,744 | |
Non-Family Households | 1,604 | 9,259 | 25,269 | |
Married Couple | 2,348 | 21,531 | 50,125 | |
Other Family | 2,664 | 16,565 | 35,619 | |
Married w/Child | 1,340 | 12,175 | 27,666 | |
Single Male w/Child | 404 | 2,573 | 5,951 | |
Single Female w/Child | 1,243 | 7,151 | 15,702 |
Population Change Last Two Decades - Plus Projection
2000 | % | 2010 | % | 2020 | % | 2030 | |
---|---|---|---|---|---|---|---|
Arizona | 5,130,632 | +25 | 6,392,017 | +14 | 7,286,100 | +14 | 8,284,900 |
Maricopa County | 3,072,149 | +24 | 3,817,117 | +16 | 4,436,900 | +15 | 5,107,700 |
Total Working Age Population:
Total Households:
Total Working Age Population:
Total Households:
Total Working Age Population:
Total Households: