Commercial Land
1875 Hwy 95 Bullhead City, AZ 86442
1875 Hwy 95 Bullhead City, AZ 86442
Details & Description
Property Highlights
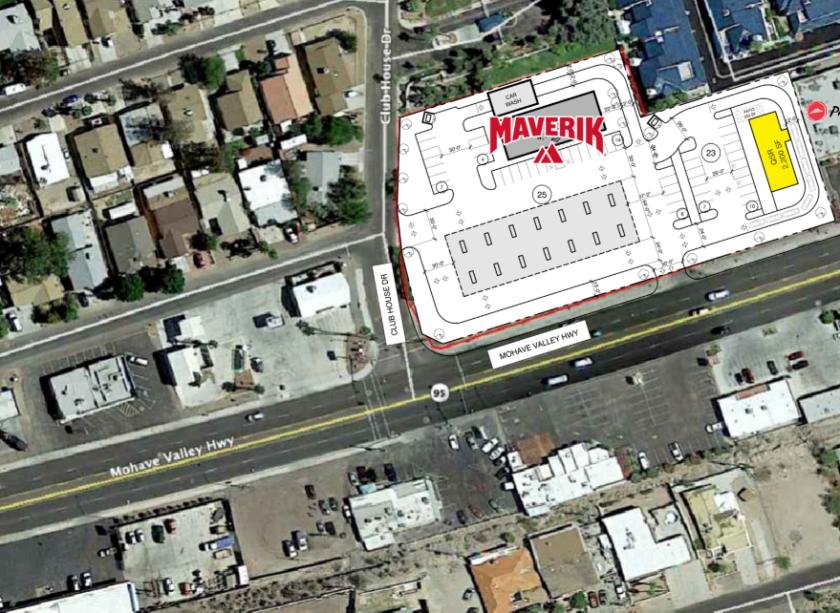
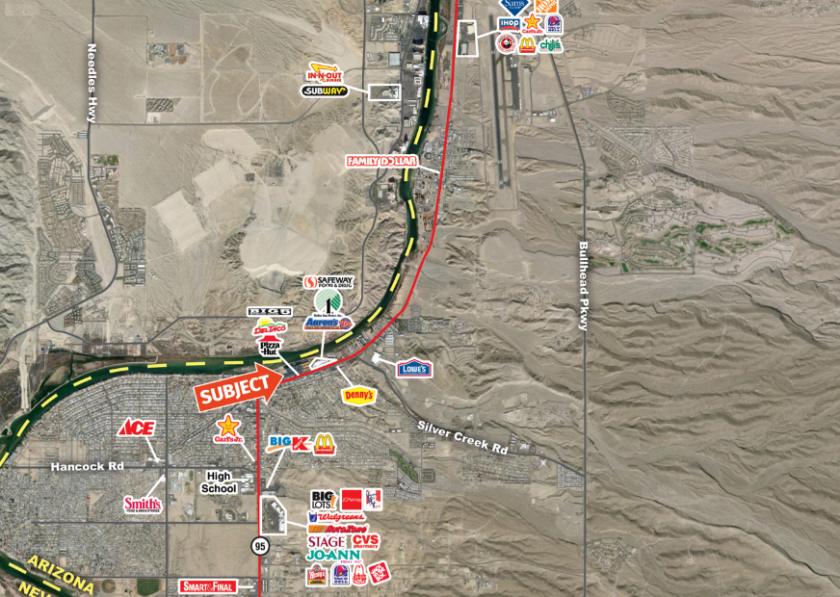
• Strategically located at the edge of the Colorado River - Less than 4 miles from the Nevada/Arizona border
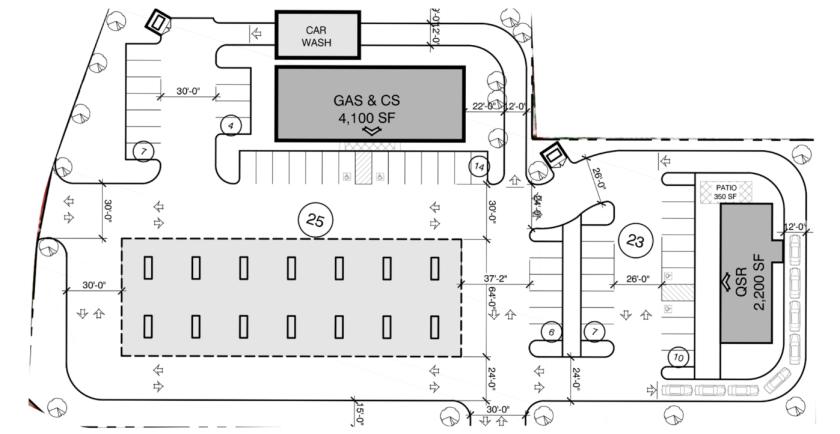
• ± 2,200 SF Drive Thru Pad Available for Sale or Ground Lease on a ± 0.54 Acre Lot
Additional Photos

Listing Agents

Bryan Ledbetter
O: 602-795-8670
bledbetter@w-retail.com
O: 602-795-8670
bledbetter@w-retail.com

Bryan Babits
O: 602-931-4491
bbabits@w-retail.com
O: 602-931-4491
bbabits@w-retail.com
While we strive to provide the most accurate information, all listing information, and demographic data, is provided by third-parties. As such, MyEListing will not be responsible for the accuracy of the information. It is strongly recommended that you verify all information with the listing agent, and any relevant agencies, prior to making any decisions.


