Commercial Land
5757 E State Rte 69 Prescott Valley, AZ 86314
5757 E State Rte 69 Prescott Valley, AZ 86314

Details & Description
Property Highlights
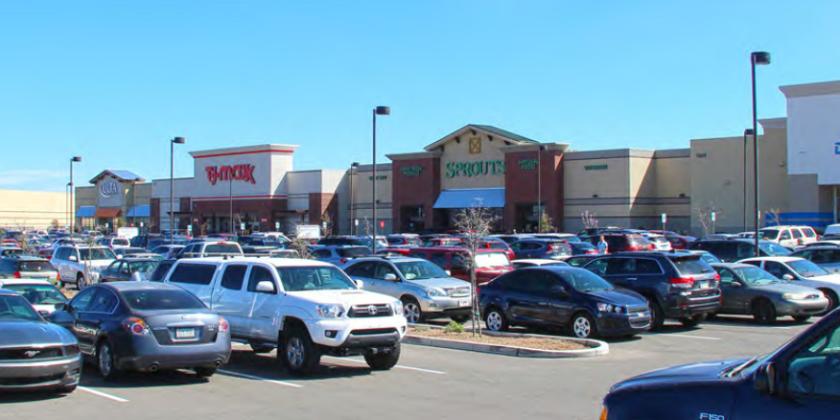
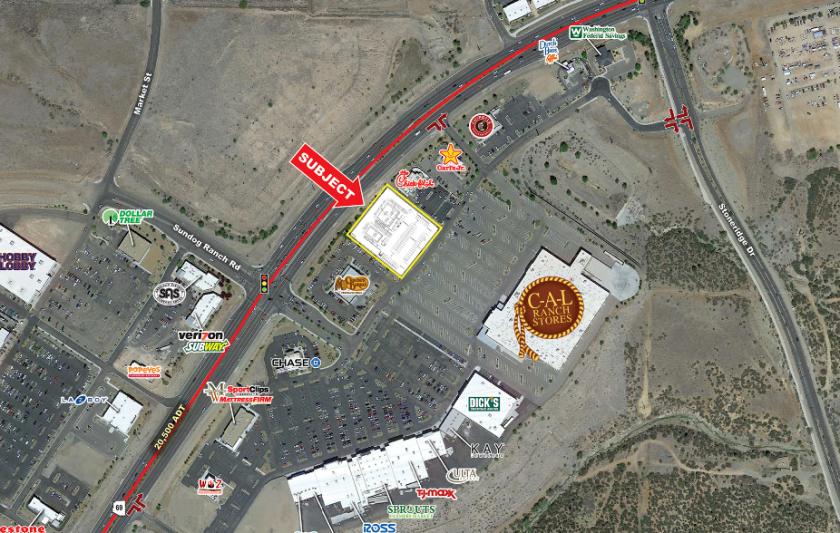
• Outstanding location off of Highway 69 brings in customers from Prescott and Prescott Valley
• Strong co-tenancy, including Sprouts, Dick’s Sporting Goods, TJ Maxx, Ulta and more
Additional Photos


Listing Agents

Neil Board
O: 602-778-3781
nboard@w-retail.com
O: 602-778-3781
nboard@w-retail.com

Bryan Ledbetter
O: 602-795-8670
bledbetter@w-retail.com
O: 602-795-8670
bledbetter@w-retail.com

Katie Weeks
O: 602-368-1372
kweeks@w-retail.com
O: 602-368-1372
kweeks@w-retail.com
While we strive to provide the most accurate information, all listing information, and demographic data, is provided by third-parties. As such, MyEListing will not be responsible for the accuracy of the information. It is strongly recommended that you verify all information with the listing agent, and any relevant agencies, prior to making any decisions.


