Retail Space
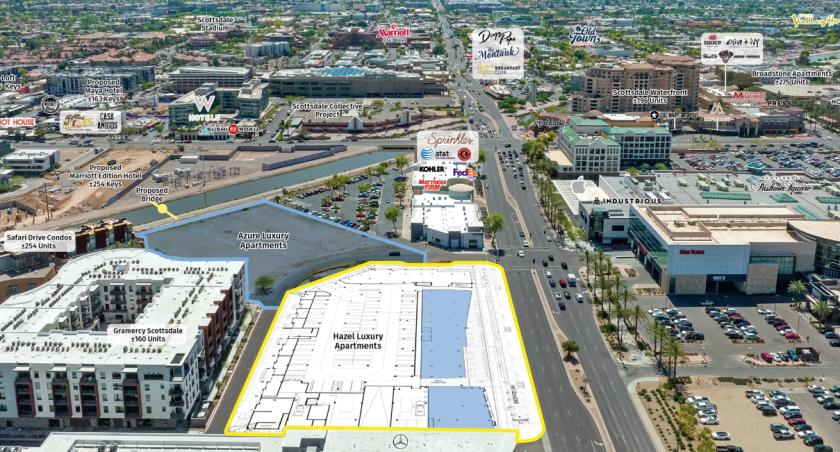
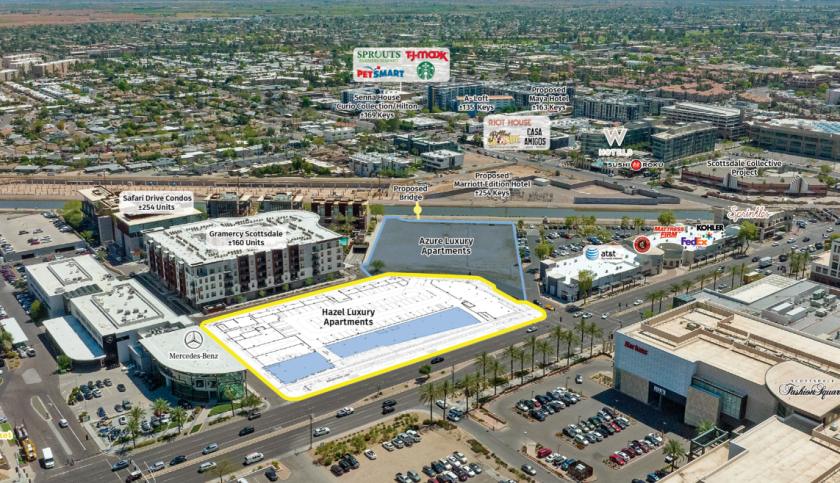
NEC Scottsdale Rd and Camelback Rd Scottsdale, AZ 85251
NEC Scottsdale Rd and Camelback Rd Scottsdale, AZ 85251

Details & Description
Property Highlights
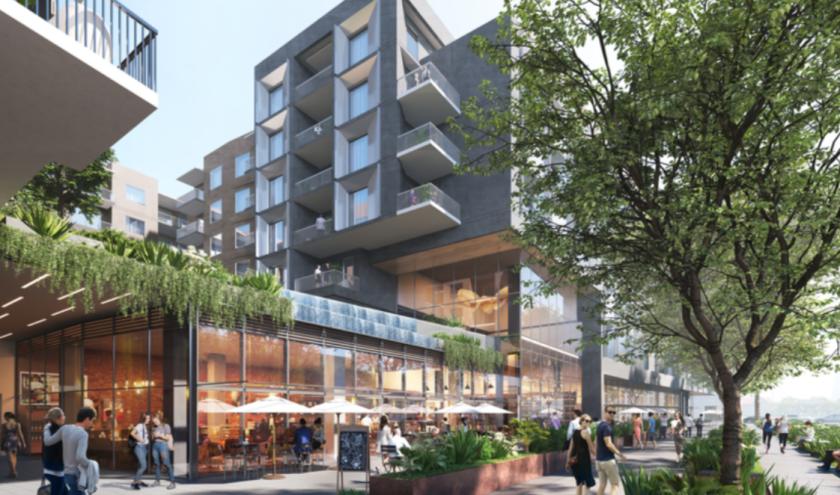
- • 5,000 sf of patio available
- • ±60,000 VPD
- • Below luxury apartments
Additional Photos

Listing Agents

Bryan Babits
O: 602-931-4491
bbabits@w-retail.com
O: 602-931-4491
bbabits@w-retail.com

Charles Skaggs
O: 602-368-1737
cskaggs@w-retail.com
O: 602-368-1737
cskaggs@w-retail.com

Brian Gausden
O: 602-778-3740
bgausden@w-retail.com
O: 602-778-3740
bgausden@w-retail.com
While we strive to provide the most accurate information, all listing information, and demographic data, is provided by third-parties. As such, MyEListing will not be responsible for the accuracy of the information. It is strongly recommended that you verify all information with the listing agent, and any relevant agencies, prior to making any decisions.


