Retail Space
57990 Twentynine Palms Highway Yucca Valley, CA 92284
57990 Twentynine Palms Highway Yucca Valley, CA 92284
Details & Description
Property Highlights
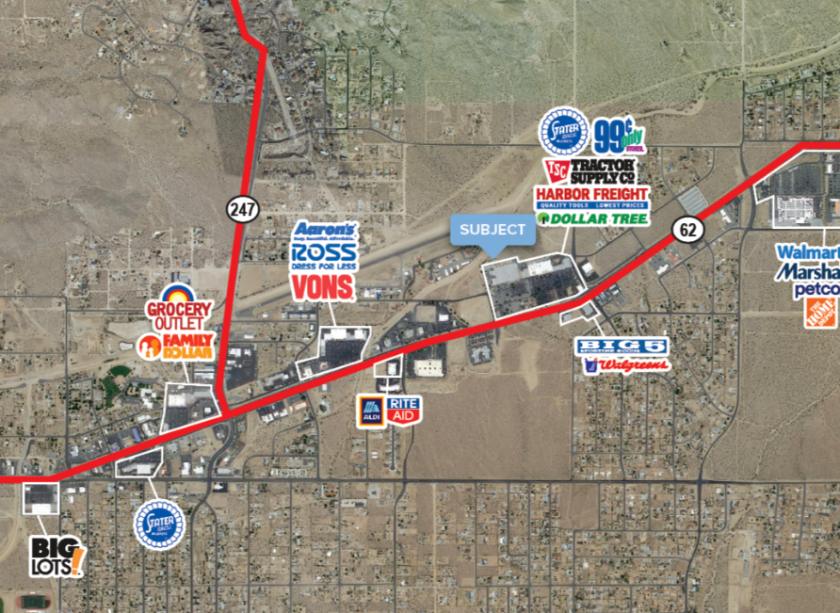
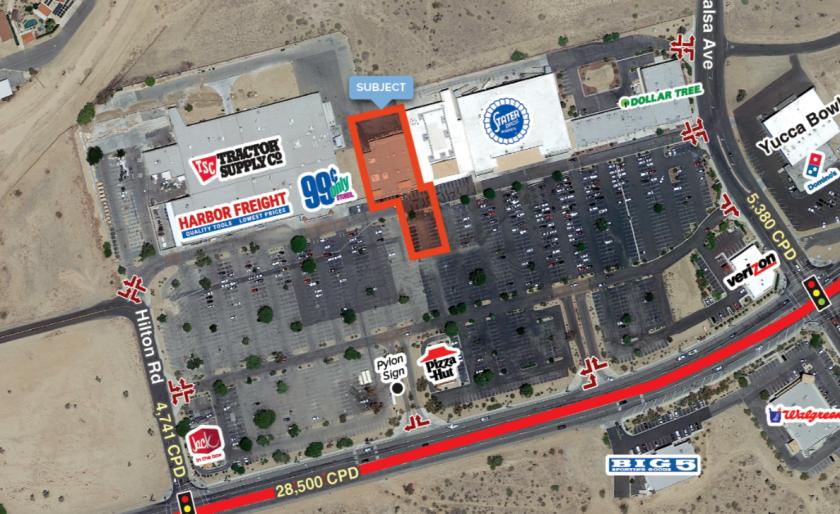
• Yucca Valley Square draws from nearby 29 Palms Marine Corps Base with approx. 12,500 active military
• 9,501 SF junior box and two shop spaces (1,235 SF & 2,857 SF)
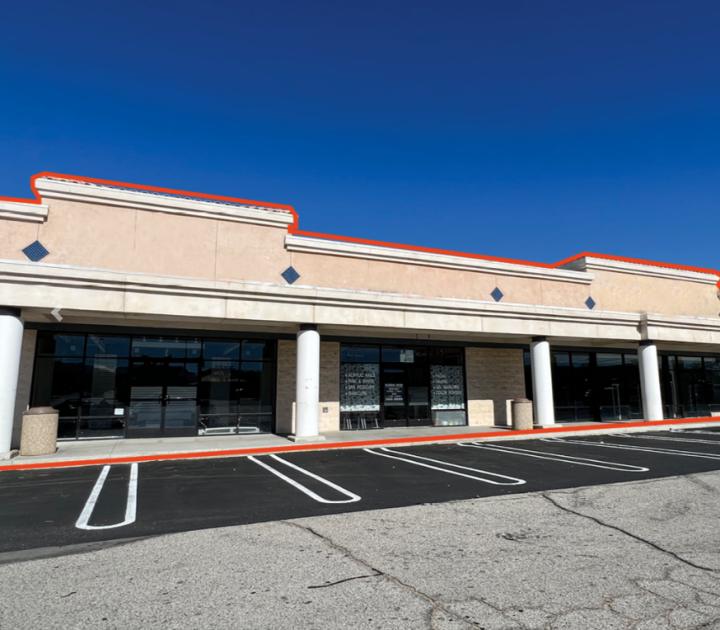
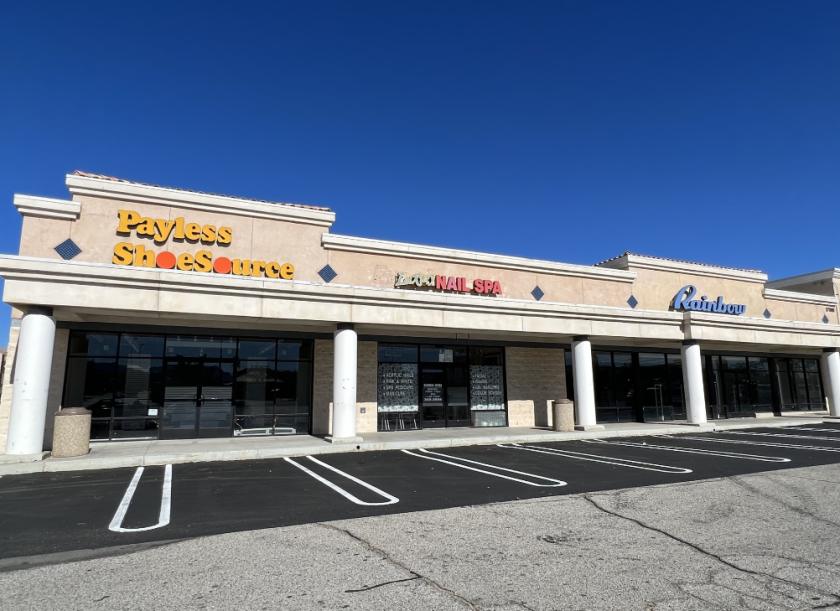
Additional Photos
Listing Agents

Alfredo Arguello
O: 949-955-0391
M: 949-988-3205
aarguello@w-retail.com
O: 949-955-0391
M: 949-988-3205
aarguello@w-retail.com

John Romm
O: 949-955-0391
M: 949-988-3202
jromm@w-retail.com
O: 949-955-0391
M: 949-988-3202
jromm@w-retail.com
While we strive to provide the most accurate information, all listing information, and demographic data, is provided by third-parties. As such, MyEListing will not be responsible for the accuracy of the information. It is strongly recommended that you verify all information with the listing agent, and any relevant agencies, prior to making any decisions.


