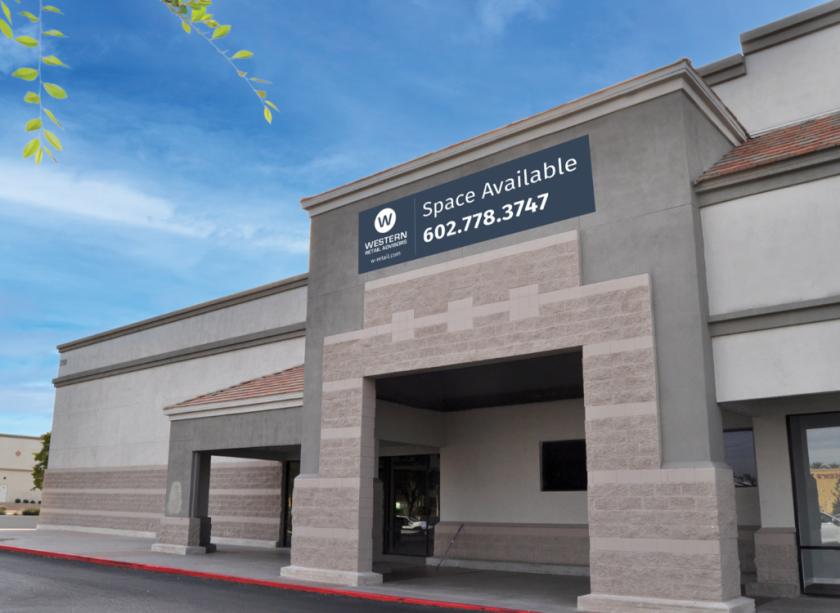
Retail Space
7759 West Bell Road Peoria, AZ 85382
7759 West Bell Road Peoria, AZ 85382
Details & Description
Property Highlights
• Across from Arrowhead Mall the third-highest regional mall by sales volume in Arizona $951 per square foot
• Densely populated trade area with over 113,335 residents within a three-mile radius
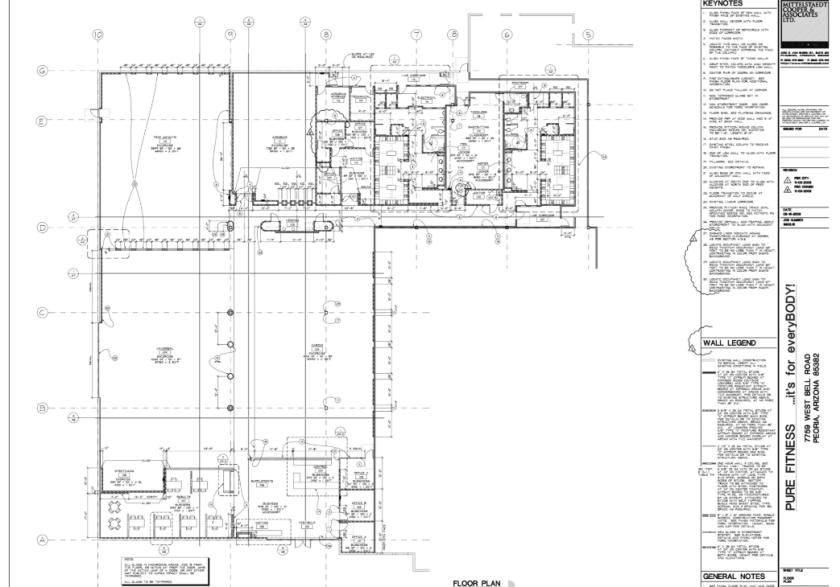
Additional Photos


Listing Agents

Neil Board
O: 602-778-3781
nboard@w-retail.com
O: 602-778-3781
nboard@w-retail.com

Noah Anastassatos
Western Retail Advisors
M: 602-778-3747
nanastassatos@w-retail.com
Western Retail Advisors
M: 602-778-3747
nanastassatos@w-retail.com
While we strive to provide the most accurate information, all listing information, and demographic data, is provided by third-parties. As such, MyEListing will not be responsible for the accuracy of the information. It is strongly recommended that you verify all information with the listing agent, and any relevant agencies, prior to making any decisions.


