Office Space
537 East Pete Rose Way Cincinnati, OH 45202
537 East Pete Rose Way Cincinnati, OH 45202

Details & Description
Property Highlights
- • Multiple Suites Available
- • Attractive Lease Rates
- • Flexible Lease Terms
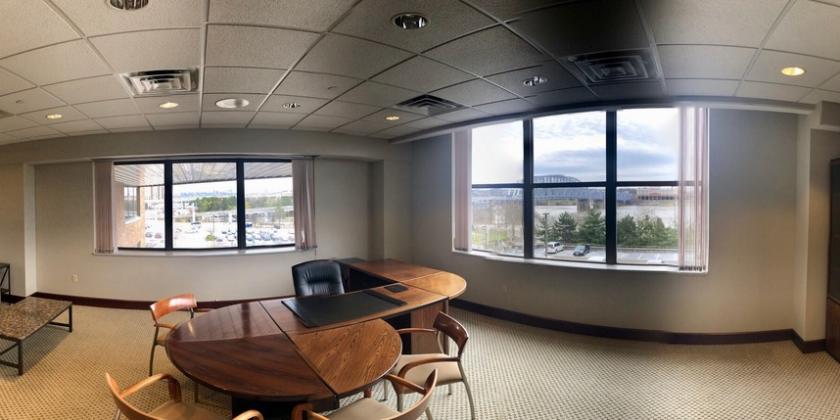
- • Turn-Key Suites Available
- • Front Desk Attendant
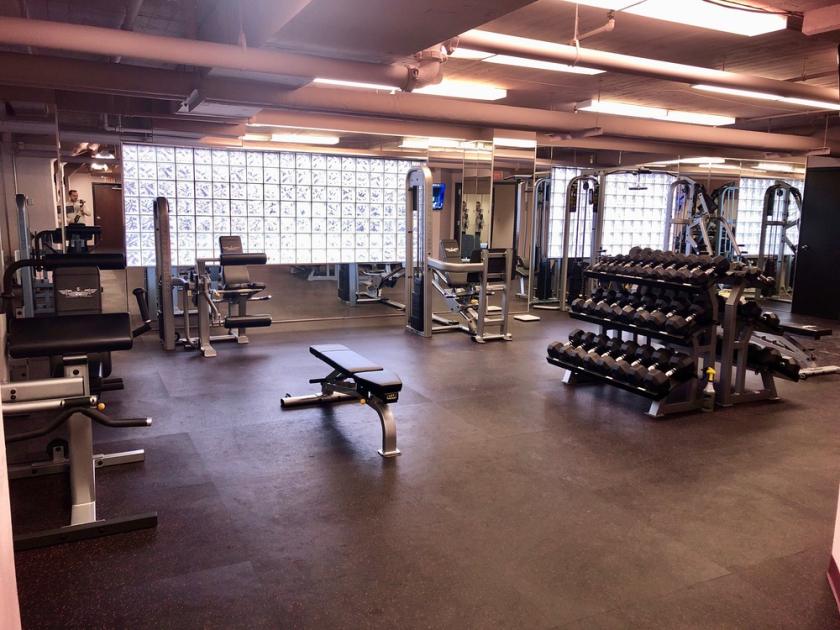
- • Onsite Fitness Center Included In Rate
Additional Photos


Listing Agents

Matt Hiudt
O: 513-322-6310
M: 513-479-2050
mhiudt@bergmancommercial.com
O: 513-322-6310
M: 513-479-2050
mhiudt@bergmancommercial.com

Gueorgui Chikov
O: 513-322-6317
M: 513-331-0920
gchikov@bergmancommercial.com
O: 513-322-6317
M: 513-331-0920
gchikov@bergmancommercial.com
While we strive to provide the most accurate information, all listing information, and demographic data, is provided by third-parties. As such, MyEListing will not be responsible for the accuracy of the information. It is strongly recommended that you verify all information with the listing agent, and any relevant agencies, prior to making any decisions.