Retail Space
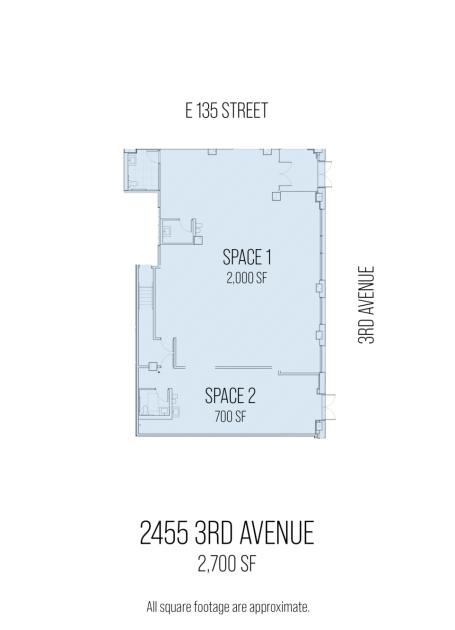
2455 3rd Avenue The Bronx, NY 10451
2455 3rd Avenue The Bronx, NY 10451

Details & Description
Property Highlights
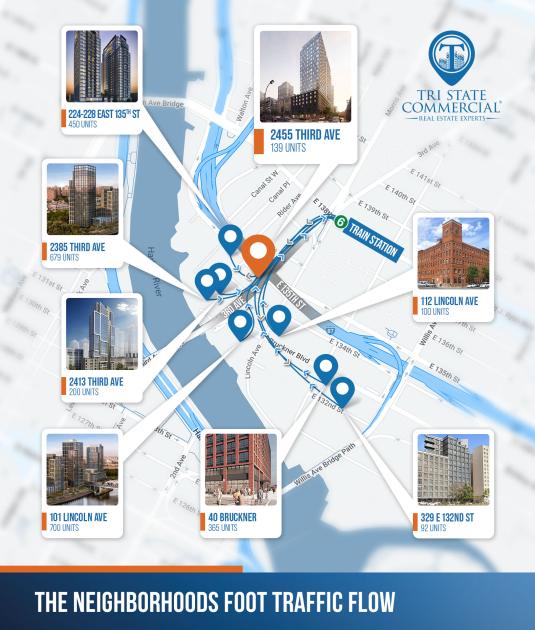
- • Best corner frontage in newly developed Mott Haven
- • High ceilings
- • Spaces can be combined
- • Brand new development
Listing Agents

Shlomi Bagdadi
O: 718-437-6100
info@tristatecr.com
O: 718-437-6100
info@tristatecr.com
While we strive to provide the most accurate information, all listing information, and demographic data, is provided by third-parties. As such, MyEListing will not be responsible for the accuracy of the information. It is strongly recommended that you verify all information with the listing agent, and any relevant agencies, prior to making any decisions.