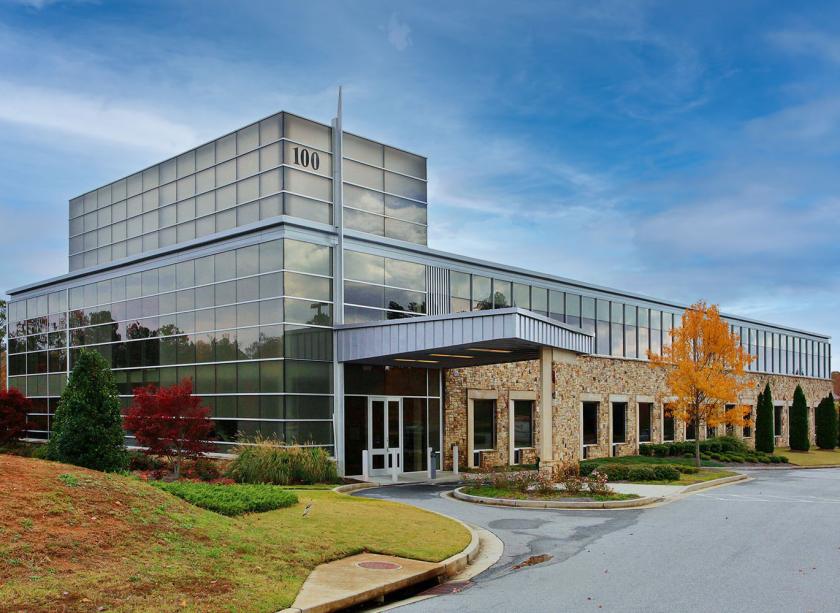
1-Mile | 3-Miles | 5-Miles | ||
---|---|---|---|---|
Total Population | 3,977 | 25,529 | 57,728 | |
Population Median Age | 42 | 42 | 40 | |
Population by Age | 0-9 Yrs | 321 (8%) | 2510 (9%) | 6006 (10%) |
10-19 Yrs | 646 (16%) | 4115 (16%) | 9633 (16%) | |
20-29 Yrs | 439 (11%) | 1904 (7%) | 5061 (8%) | |
30-39 Yrs | 291 (7%) | 2422 (9%) | 5836 (10%) | |
40-49 Yrs | 702 (17%) | 3858 (15%) | 8103 (14%) | |
50-59 Yrs | 538 (13%) | 3814 (14%) | 9510 (16%) | |
60-69 Yrs | 493 (12%) | 3859 (15%) | 7447 (12%) | |
70+ Yrs | 547 (13%) | 3046 (11%) | 6131 (10%) | |
Median HH Income | $98,855 | $106,575 | $106,910 | |
Total Household Income | < 24K | 203 (11%) | 840 (8%) | 1703 (8%) |
25-49K | 193 (11%) | 936 (9%) | 2066 (9%) | |
50-74K | 164 (9%) | 1334 (13%) | 3109 (15%) | |
75-99K | 317 (18%) | 1448 (14%) | 2784 (13%) | |
100-199K | 460 (26%) | 3275 (33%) | 7433 (35%) | |
200K+ | 389 (22%) | 1885 (19%) | 3621 (17%) | |
Highest Education Level | No Diploma | 88 | 545 | 1793 |
Diploma or GED | 528 | 2756 | 6832 | |
Some College | 376 | 3297 | 7760 | |
Assoc. Degree | 158 | 1106 | 2867 | |
Bachelors Degree | 852 | 5973 | 12419 | |
Higher Degree | 813 | 4244 | 7616 | |
Total Housing Units | 1,805 | 10,377 | 21,915 | |
--Owner-Occupied | 918 | 7,709 | 17,094 | |
--Renter-Occupied | 808 | 2,009 | 3,621 | |
Owner-Occupied Values | < 100K | 15 | 301 | 856 |
100-199K | 74 | 777 | 1970 | |
200-299K | 131 | 1570 | 4540 | |
300-399K | 216 | 1980 | 4145 | |
400-499K | 105 | 1286 | 2883 | |
500K+ | 377 | 1795 | 2700 | |
Total Working Age Population | 3,167 | 20,473 | 45,757 | |
In Work Force | 1,951 | 12,416 | 28,561 | |
Not In Work Force | 1,216 | 8,057 | 17,196 | |
Workforce Employed | 1,907 | 12,084 | 27,872 | |
Workforce Unemployed | 44 | 331 | 686 | |
Civlian Workforce | 1,951 | 12,415 | 28,557 | |
Military Workforce | 0 | 1 | 4 | |
Total Households | 1,726 | 9,718 | 20,715 | |
Family Households | 973 | 7,327 | 16,329 | |
Non-Family Households | 754 | 2,391 | 4,386 | |
Married Couple | 809 | 6,321 | 13,748 | |
Other Family | 164 | 1,006 | 2,581 | |
Married w/Child | 338 | 2,435 | 5,250 | |
Single Male w/Child | 30 | 63 | 329 | |
Single Female w/Child | 54 | 473 | 1,203 |
Population Change Last Two Decades - Plus Projection
2000 | % | 2010 | % | 2020 | % | 2030 | |
---|---|---|---|---|---|---|---|
Georgia | 8,186,453 | +18 | 9,687,653 | +12 | 10,833,472 | +13 | 12,292,423 |
Fayette County | 91,263 | +17 | 106,567 | +10 | 117,544 | +17 | 137,595 |
Coweta County | 89,215 | +43 | 127,317 | +19 | 152,001 | +18 | 179,677 |
Fulton County | 816,006 | +13 | 920,581 | +19 | 1,099,181 | +18 | 1,300,861 |
Total Working Age Population:
Total Households:
Total Working Age Population:
Total Households:
Total Working Age Population:
Total Households: