Specialty Real Estate
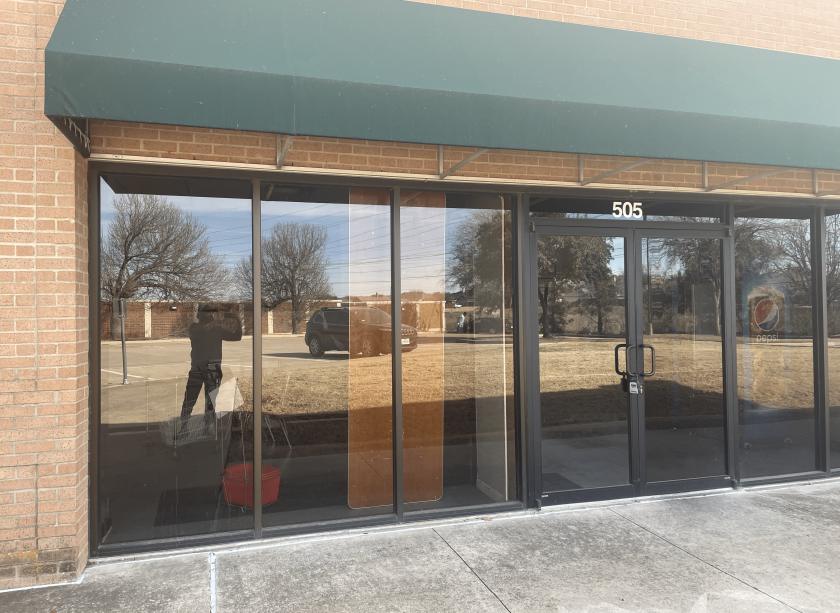
751 South MacArthur Boulevard 505 Coppell, TX 75019
751 South MacArthur Boulevard 505 Coppell, TX 75019
Details & Description
Property Highlights
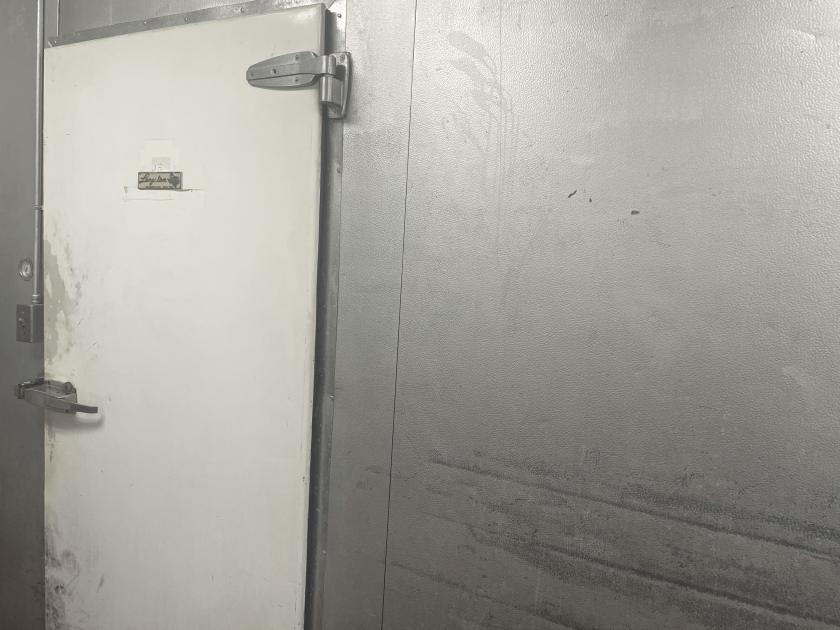
- • Walkin Cooler and Freezer
- • Show case cooler
- • Glass door cooler and freezer
- • Big electric saw
- • Grocery shelves
- • Butcher table and wrack
Additional Photos


Listing Agents

jaffa bbq
jaffabbqcoppell@gmail.com
jaffabbqcoppell@gmail.com
While we strive to provide the most accurate information, all listing information, and demographic data, is provided by third-parties. As such, MyEListing will not be responsible for the accuracy of the information. It is strongly recommended that you verify all information with the listing agent, and any relevant agencies, prior to making any decisions.