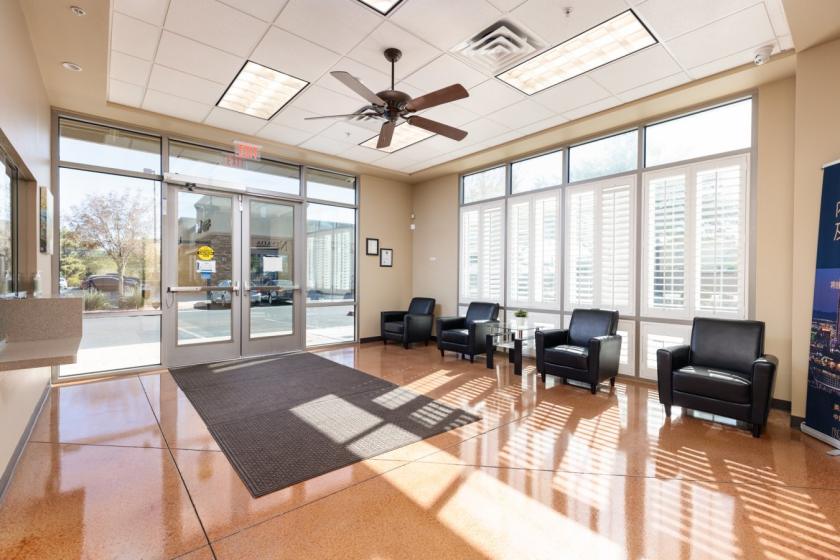
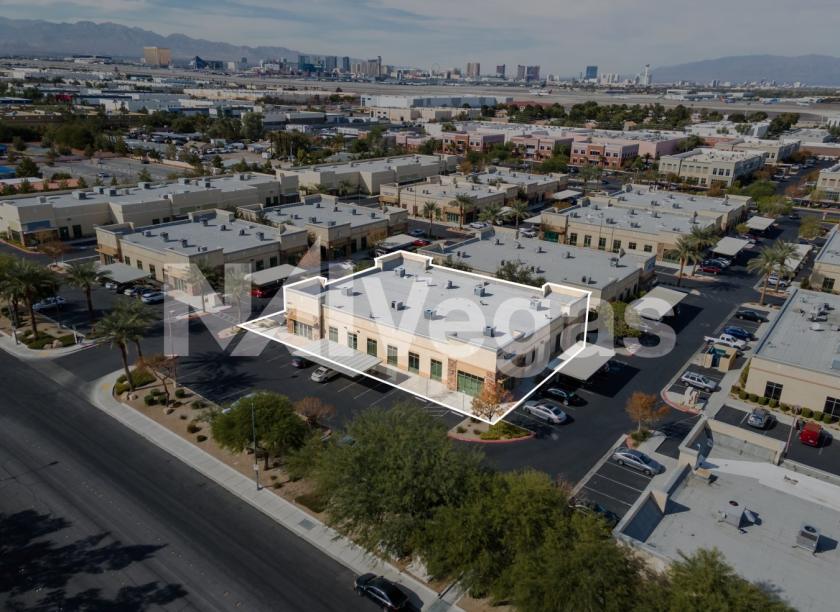
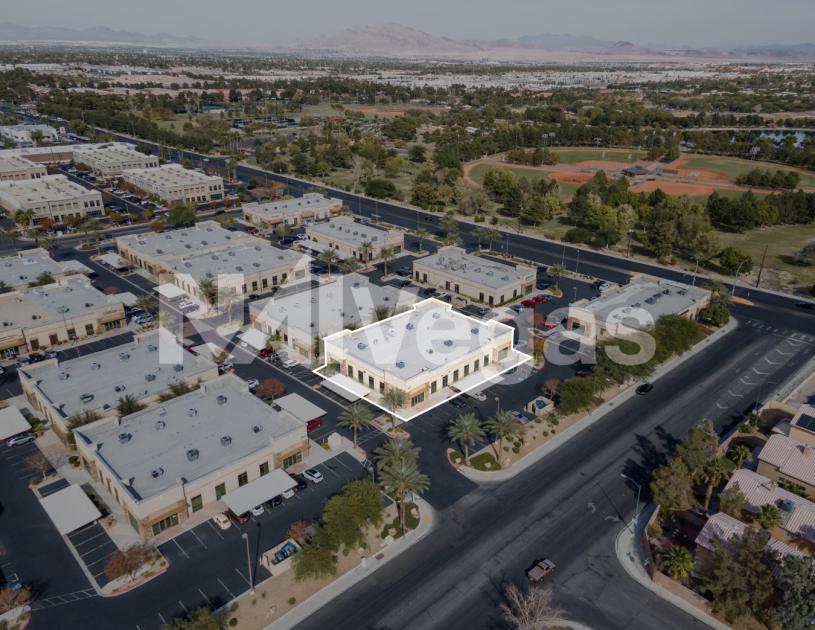
Office Space
6877 South Eastern Avenue Las Vegas, NV 89119
6877 South Eastern Avenue Las Vegas, NV 89119
Details & Description
Property Highlights
- • Total Building 10,497 SF
- • 15 Covered Parking Stalls
- • Fully Sprinklered
- • Lot size ±0.24
- • 24 Hour Access
- • Phase Power
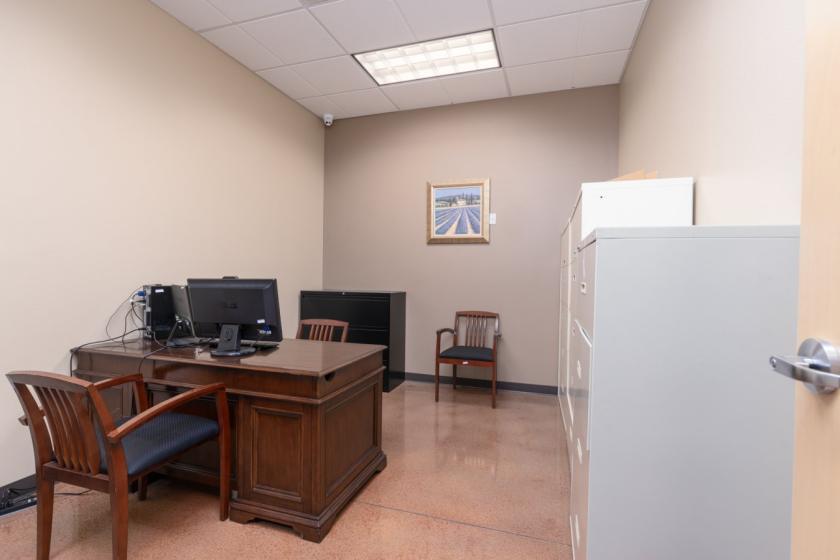
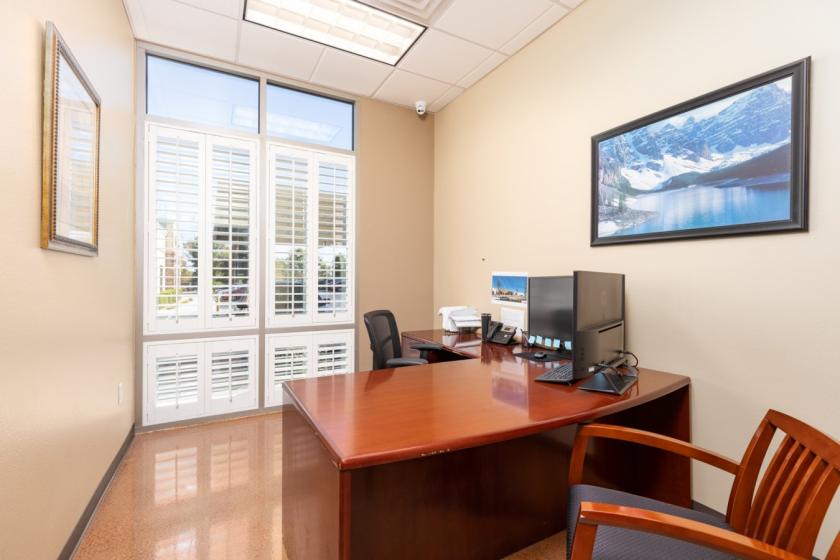
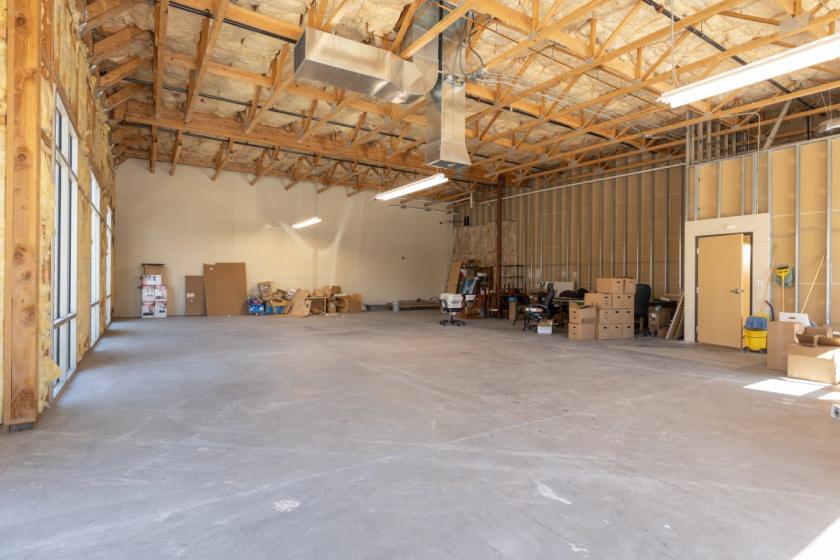
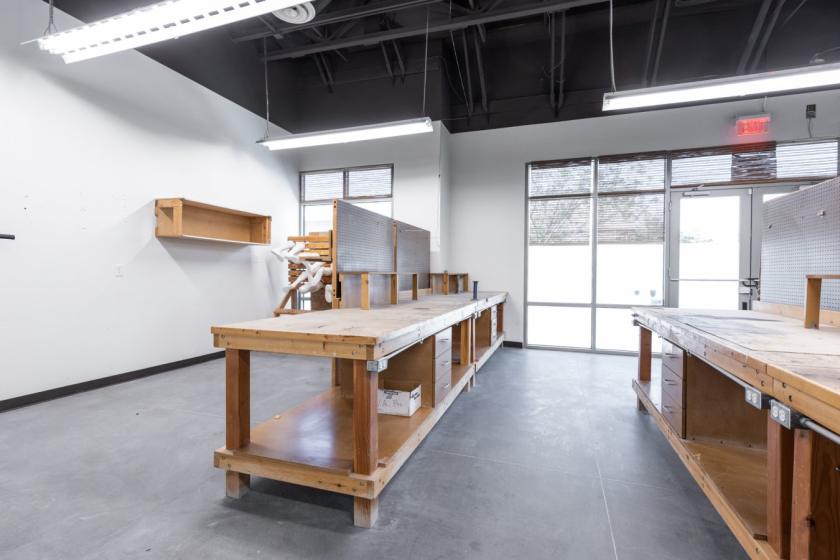
Additional Photos


Listing Agents

Erik Sexton
O: 702-383-3383
M: 702-534-1711
erik.sexton@naiexcel.com
O: 702-383-3383
M: 702-534-1711
erik.sexton@naiexcel.com
While we strive to provide the most accurate information, all listing information, and demographic data, is provided by third-parties. As such, MyEListing will not be responsible for the accuracy of the information. It is strongly recommended that you verify all information with the listing agent, and any relevant agencies, prior to making any decisions.