Retail Space
1500 Clinton Street Buffalo, NY 14206
1500 Clinton Street Buffalo, NY 14206

Details & Description
Property Highlights
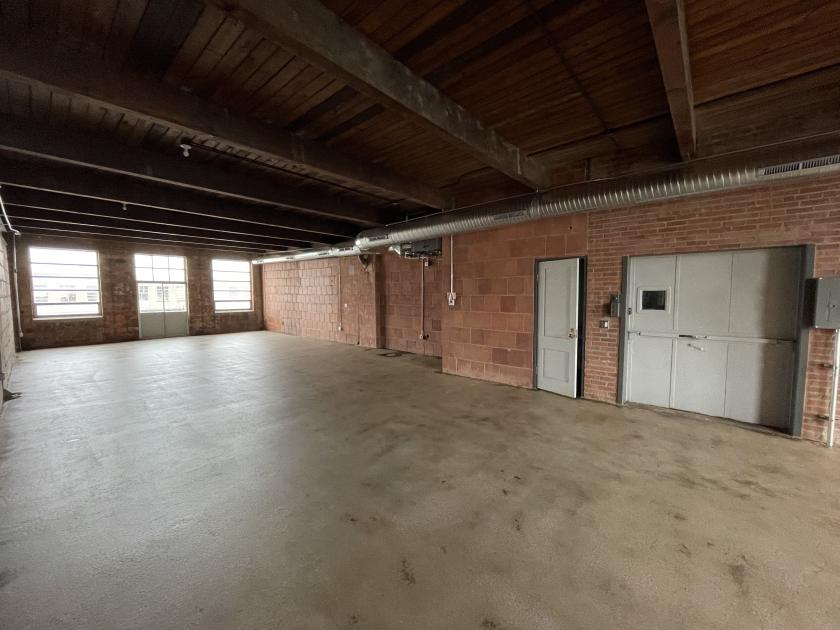
- • 12-13' Ceiling Heights
- • Fireproof Building
- • Heavy Utilities, 3 Phase Power
- • Nighttime Security Service
- • On-Demand maintenance and consistent snow removal
- • Plenty of Parking
Additional Photos


Listing Agents

Rick Recckio
O: 716-631-5555
M: 716-998-4422
rick@recckio.com
O: 716-631-5555
M: 716-998-4422
rick@recckio.com
While we strive to provide the most accurate information, all listing information, and demographic data, is provided by third-parties. As such, MyEListing will not be responsible for the accuracy of the information. It is strongly recommended that you verify all information with the listing agent, and any relevant agencies, prior to making any decisions.


