Industrial Properties
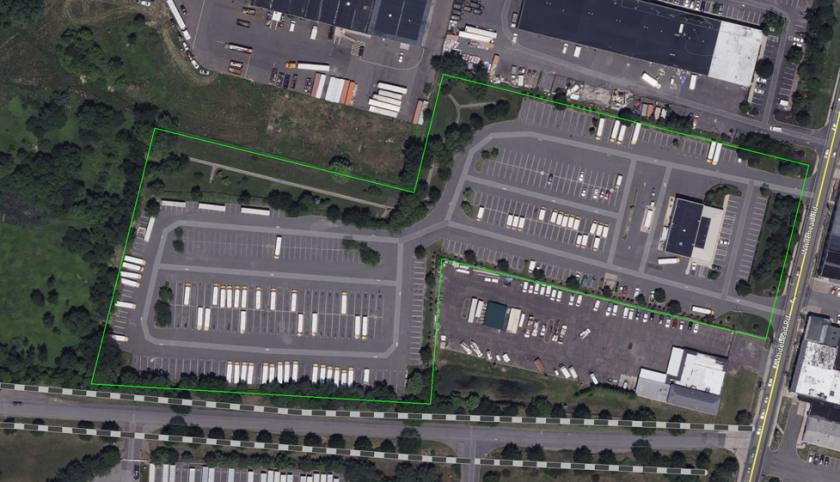
265 Whitehead Road Trenton, NJ 08619
265 Whitehead Road Trenton, NJ 08619

Details & Description
Property Highlights
• ±9-Acre Truck Terminal
• ±9-Acre Truck Terminal
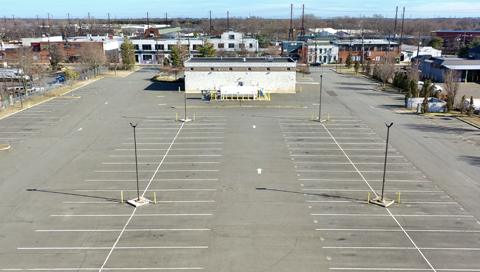
Additional Photos


Listing Agents

Troy Schaafsma
O: 973-379-6644
M: 973-906-5112
troys@blauberg.com
O: 973-379-6644
M: 973-906-5112
troys@blauberg.com
While we strive to provide the most accurate information, all listing information, and demographic data, is provided by third-parties. As such, MyEListing will not be responsible for the accuracy of the information. It is strongly recommended that you verify all information with the listing agent, and any relevant agencies, prior to making any decisions.