Retail Space
247 North Main Street Weaverville, NC 28787
247 North Main Street Weaverville, NC 28787

Details & Description
Property Highlights
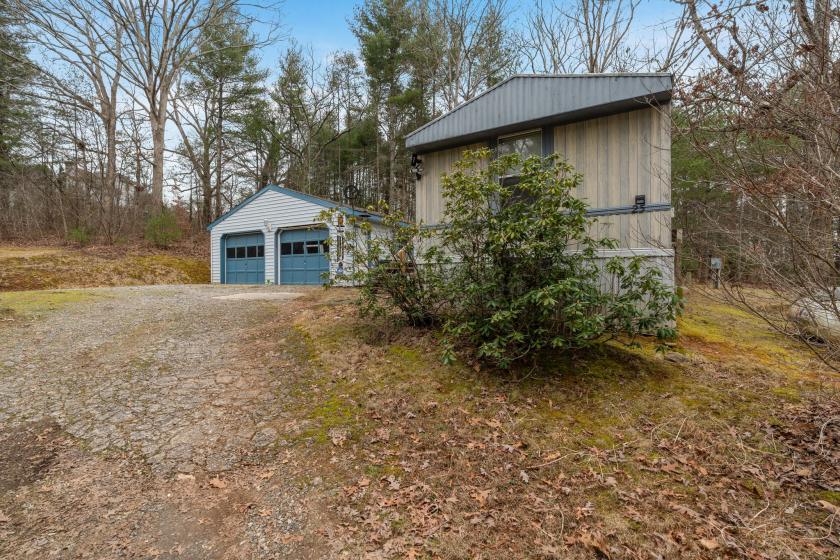
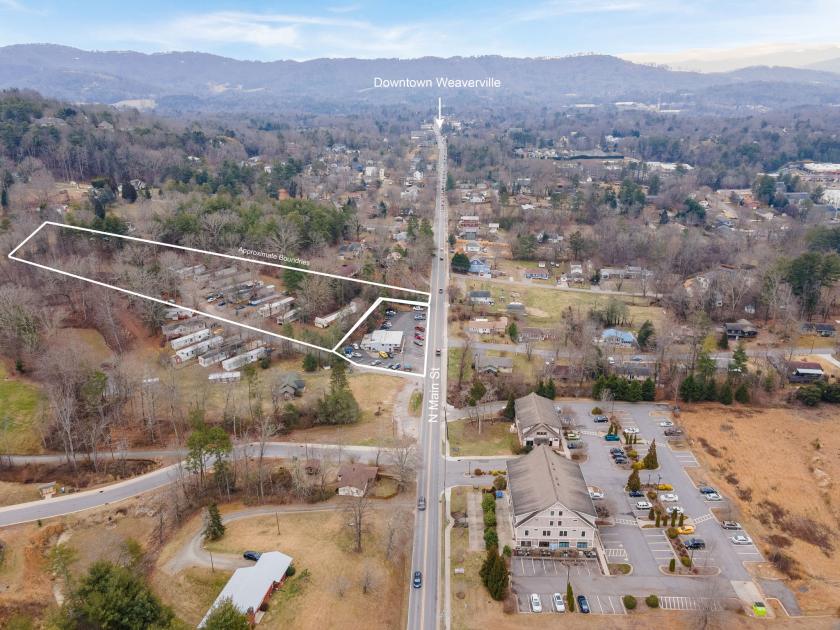
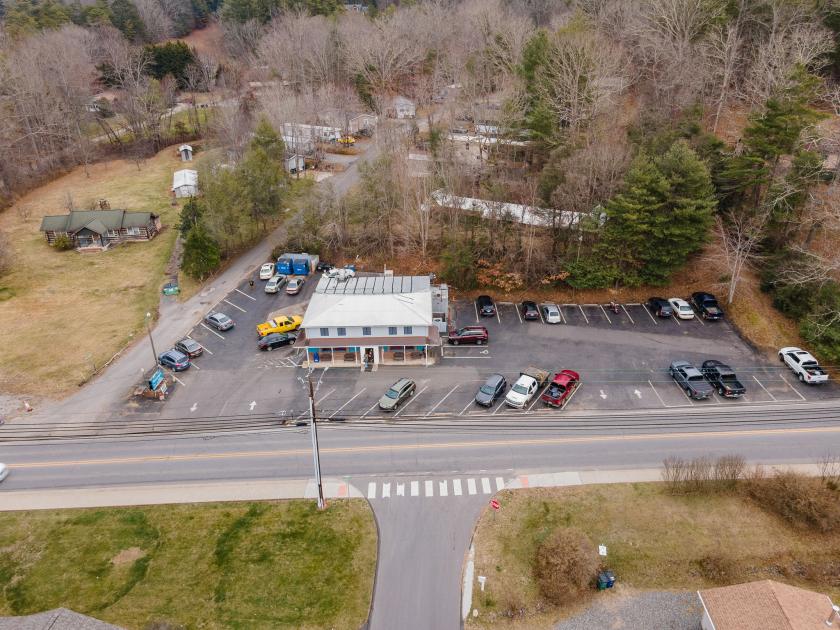
• 2 Separate Parcels being Sold Together totaling 3.16 Acres! Restaurant Building and 9 Unit Mobile Home Park
• 9 Unit Mobile Home Park with Long Term Tenants on Month to Month Lease; TWO mobile homes INCLUDED in sale
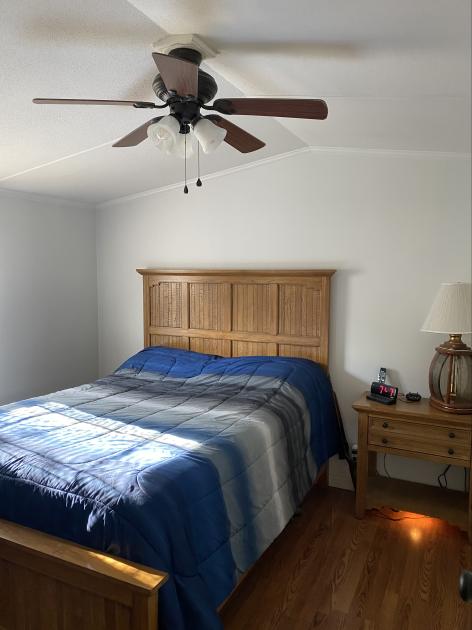
Additional Photos


Listing Agents

Georgiana MacKay
gmackay@bluehighlandsre.com
gmackay@bluehighlandsre.com
While we strive to provide the most accurate information, all listing information, and demographic data, is provided by third-parties. As such, MyEListing will not be responsible for the accuracy of the information. It is strongly recommended that you verify all information with the listing agent, and any relevant agencies, prior to making any decisions.