Industrial Properties
3111 North Stone Avenue Colorado Springs, CO 80907
3111 North Stone Avenue Colorado Springs, CO 80907
Details & Description
Property Highlights
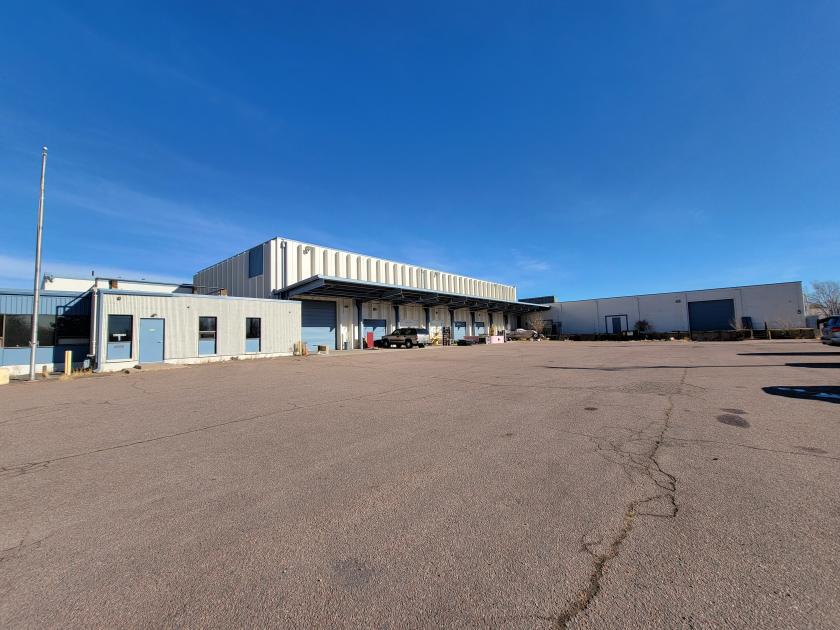
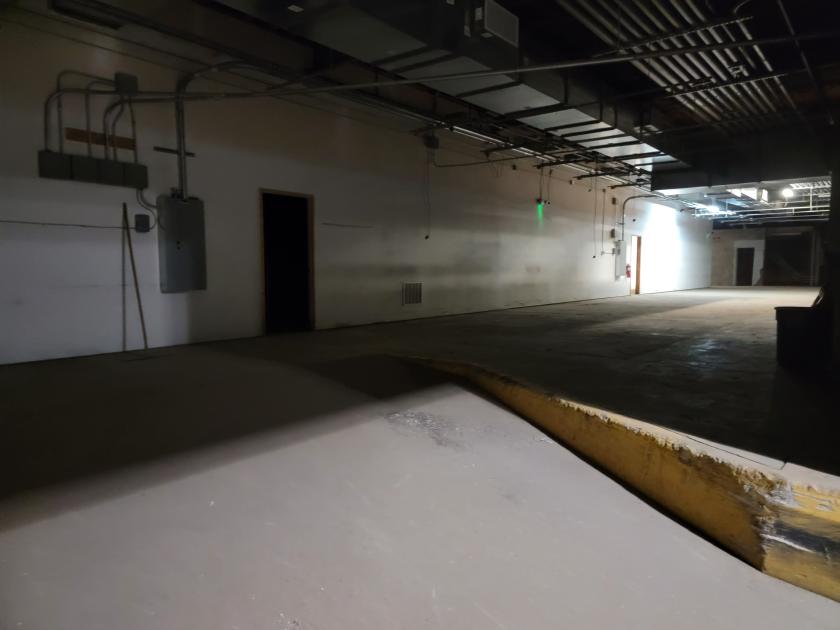
- • Large warehouse space with high ceiling clearance
- • Heavy electric capacity
- • Fire suppression system
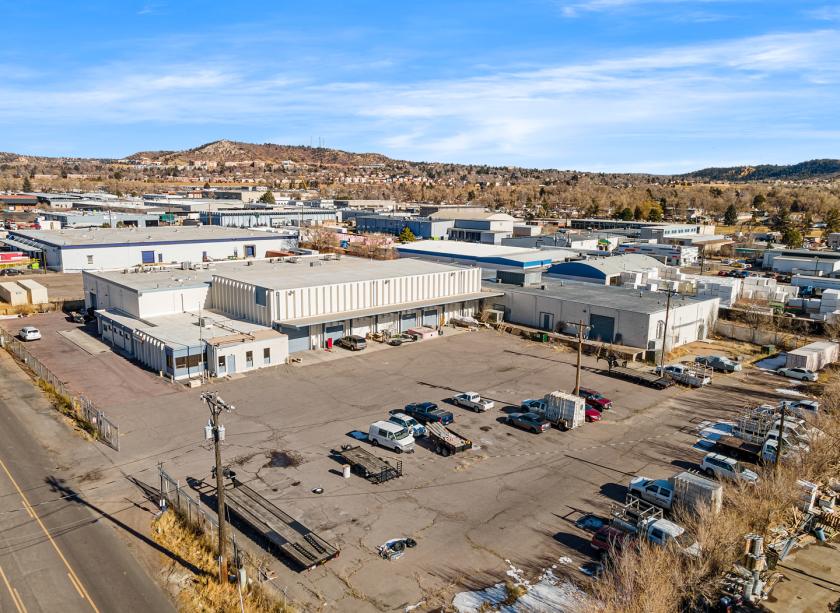
- • Fenced 2.55 acre lot
Additional Photos


Listing Agents

Jason Castro
jason@peakcp.net
jason@peakcp.net
While we strive to provide the most accurate information, all listing information, and demographic data, is provided by third-parties. As such, MyEListing will not be responsible for the accuracy of the information. It is strongly recommended that you verify all information with the listing agent, and any relevant agencies, prior to making any decisions.