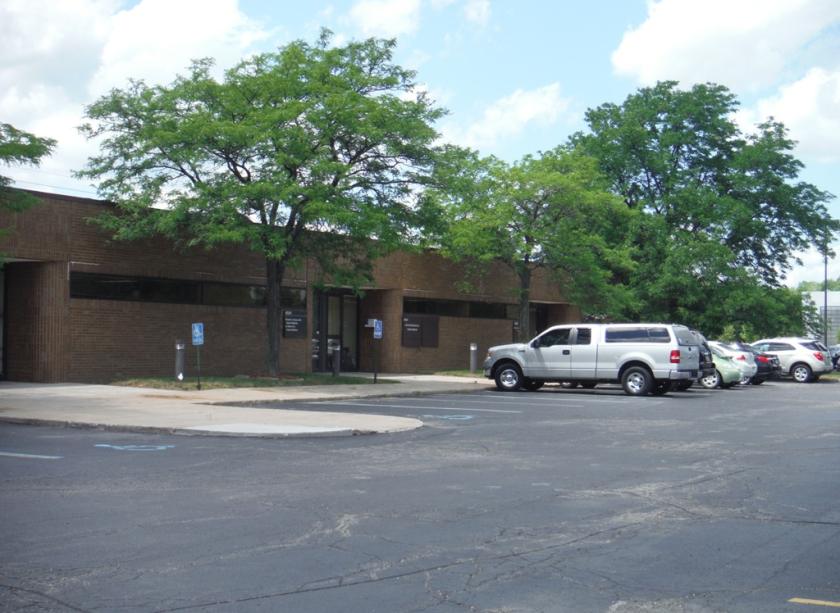
1-Mile | 3-Miles | 5-Miles | ||
---|---|---|---|---|
Total Population | 14,695 | 110,322 | 264,322 | |
Population Median Age | 44 | 41 | 41 | |
Population by Age | 0-9 Yrs | 1732 (11%) | 11845 (10%) | 28903 (10%) |
10-19 Yrs | 1008 (6%) | 12404 (11%) | 32594 (12%) | |
20-29 Yrs | 2074 (14%) | 14741 (13%) | 34032 (12%) | |
30-39 Yrs | 2117 (14%) | 13537 (12%) | 31638 (11%) | |
40-49 Yrs | 1530 (10%) | 14038 (12%) | 34787 (13%) | |
50-59 Yrs | 1649 (11%) | 14829 (13%) | 37878 (14%) | |
60-69 Yrs | 1664 (11%) | 14318 (12%) | 32209 (12%) | |
70+ Yrs | 2921 (19%) | 14609 (13%) | 32282 (12%) | |
Median HH Income | $57,682 | $73,880 | $70,000 | |
Total Household Income | < 24K | 1365 (18%) | 6301 (13%) | 15536 (14%) |
25-49K | 1938 (25%) | 9530 (20%) | 22780 (21%) | |
50-74K | 1501 (20%) | 7506 (16%) | 18699 (17%) | |
75-99K | 1147 (15%) | 7253 (15%) | 14810 (13%) | |
100-199K | 1259 (16%) | 12491 (27%) | 28213 (26%) | |
200K+ | 248 (3%) | 2888 (6%) | 6303 (5%) | |
Highest Education Level | No Diploma | 677 | 5533 | 15153 |
Diploma or GED | 3870 | 22152 | 54306 | |
Some College | 2861 | 19716 | 45236 | |
Assoc. Degree | 985 | 8860 | 20172 | |
Bachelors Degree | 1760 | 14979 | 33836 | |
Higher Degree | 979 | 8176 | 18124 | |
Total Housing Units | 7,902 | 47,707 | 110,776 | |
--Owner-Occupied | 4,319 | 33,571 | 79,346 | |
--Renter-Occupied | 3,139 | 12,398 | 26,995 | |
Owner-Occupied Values | < 100K | 401 | 2690 | 11152 |
100-199K | 2760 | 12692 | 27981 | |
200-299K | 762 | 12610 | 25241 | |
300-399K | 276 | 4465 | 11631 | |
400-499K | 116 | 867 | 2364 | |
500K+ | 5 | 247 | 977 | |
Total Working Age Population | 12,394 | 91,240 | 216,322 | |
In Work Force | 7,595 | 59,264 | 139,973 | |
Not In Work Force | 4,799 | 31,976 | 76,349 | |
Workforce Employed | 7,233 | 56,449 | 132,602 | |
Workforce Unemployed | 350 | 2,764 | 7,202 | |
Civlian Workforce | 7,583 | 59,212 | 139,804 | |
Military Workforce | 12 | 52 | 169 | |
Total Households | 7,458 | 45,969 | 106,341 | |
Family Households | 3,676 | 29,123 | 69,098 | |
Non-Family Households | 3,781 | 16,846 | 37,243 | |
Married Couple | 2,624 | 23,105 | 53,271 | |
Other Family | 1,052 | 6,018 | 15,827 | |
Married w/Child | 821 | 8,790 | 20,707 | |
Single Male w/Child | 79 | 548 | 1,562 | |
Single Female w/Child | 416 | 1,913 | 5,467 |
Population Change Last Two Decades - Plus Projection
2000 | % | 2010 | % | 2020 | % | 2030 | |
---|---|---|---|---|---|---|---|
Michigan | 9,938,444 | -1 | 9,883,640 | +1 | 10,023,423 | +4 | 10,424,510 |
Macomb County | 788,149 | +7 | 840,978 | +5 | 883,020 | +6 | 933,965 |
Total Working Age Population:
Total Households:
Total Working Age Population:
Total Households:
Total Working Age Population:
Total Households: