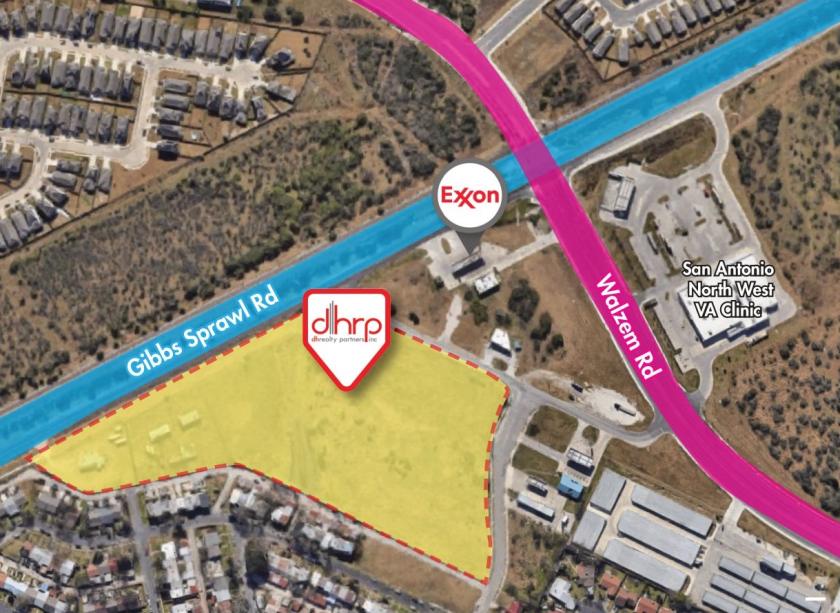
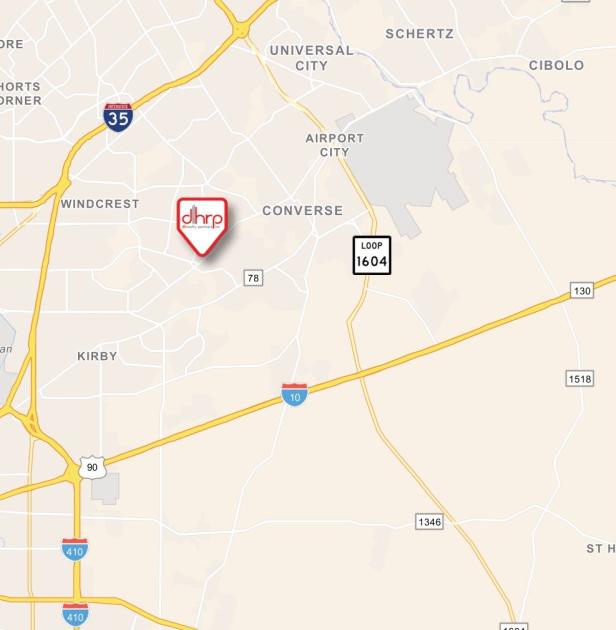
1-Mile | 3-Miles | 5-Miles | ||
---|---|---|---|---|
Total Population | 11,973 | 105,902 | 214,642 | |
Population Median Age | 35 | 36 | 36 | |
Population by Age | 0-9 Yrs | 1782 (14%) | 15836 (14%) | 31643 (14%) |
10-19 Yrs | 1525 (12%) | 14721 (13%) | 30024 (13%) | |
20-29 Yrs | 1645 (13%) | 14863 (14%) | 30677 (14%) | |
30-39 Yrs | 2050 (17%) | 16522 (15%) | 33032 (15%) | |
40-49 Yrs | 1598 (13%) | 13274 (12%) | 25914 (12%) | |
50-59 Yrs | 1579 (13%) | 12560 (11%) | 25138 (11%) | |
60-69 Yrs | 1051 (8%) | 10430 (9%) | 21111 (9%) | |
70+ Yrs | 743 (6%) | 7696 (7%) | 17103 (7%) | |
Median HH Income | $63,073 | $59,537 | $56,513 | |
Total Household Income | < 24K | 554 (15%) | 5161 (15%) | 12554 (18%) |
25-49K | 793 (22%) | 7644 (23%) | 17578 (25%) | |
50-74K | 831 (23%) | 7171 (22%) | 15206 (21%) | |
75-99K | 531 (15%) | 5196 (16%) | 9614 (13%) | |
100-199K | 706 (20%) | 6291 (19%) | 12566 (18%) | |
200K+ | 102 (2%) | 879 (2%) | 1812 (2%) | |
Highest Education Level | No Diploma | 1213 | 8839 | 17744 |
Diploma or GED | 2250 | 18356 | 39717 | |
Some College | 1889 | 18075 | 36725 | |
Assoc. Degree | 849 | 6775 | 13656 | |
Bachelors Degree | 1246 | 10541 | 20576 | |
Higher Degree | 444 | 5581 | 10355 | |
Total Housing Units | 3,784 | 34,444 | 73,735 | |
--Owner-Occupied | 2,654 | 22,038 | 42,828 | |
--Renter-Occupied | 863 | 10,302 | 26,503 | |
Owner-Occupied Values | < 100K | 699 | 4037 | 8636 |
100-199K | 1584 | 13562 | 25679 | |
200-299K | 358 | 3781 | 6622 | |
300-399K | 12 | 541 | 1133 | |
400-499K | 1 | 11 | 329 | |
500K+ | 0 | 106 | 428 | |
Total Working Age Population | 9,289 | 81,204 | 163,922 | |
In Work Force | 6,228 | 52,698 | 107,951 | |
Not In Work Force | 3,060 | 28,506 | 55,972 | |
Workforce Employed | 5,906 | 49,062 | 100,029 | |
Workforce Unemployed | 251 | 2,795 | 5,773 | |
Civlian Workforce | 6,157 | 51,857 | 105,802 | |
Military Workforce | 71 | 842 | 2,149 | |
Total Households | 3,517 | 32,341 | 69,331 | |
Family Households | 2,529 | 23,098 | 46,672 | |
Non-Family Households | 988 | 9,243 | 22,659 | |
Married Couple | 1,560 | 15,306 | 30,907 | |
Other Family | 970 | 7,792 | 15,766 | |
Married w/Child | 724 | 6,353 | 12,911 | |
Single Male w/Child | 186 | 932 | 1,715 | |
Single Female w/Child | 244 | 3,113 | 6,859 |
Population Change Last Two Decades - Plus Projection
2000 | % | 2010 | % | 2020 | % | 2030 | |
---|---|---|---|---|---|---|---|
Texas | 20,851,820 | +21 | 25,145,561 | +18 | 29,677,668 | +18 | 34,894,452 |
Bexar County | 1,392,931 | +23 | 1,714,773 | +22 | 2,093,502 | +20 | 2,502,617 |
Total Working Age Population:
Total Households:
Total Working Age Population:
Total Households:
Total Working Age Population:
Total Households: