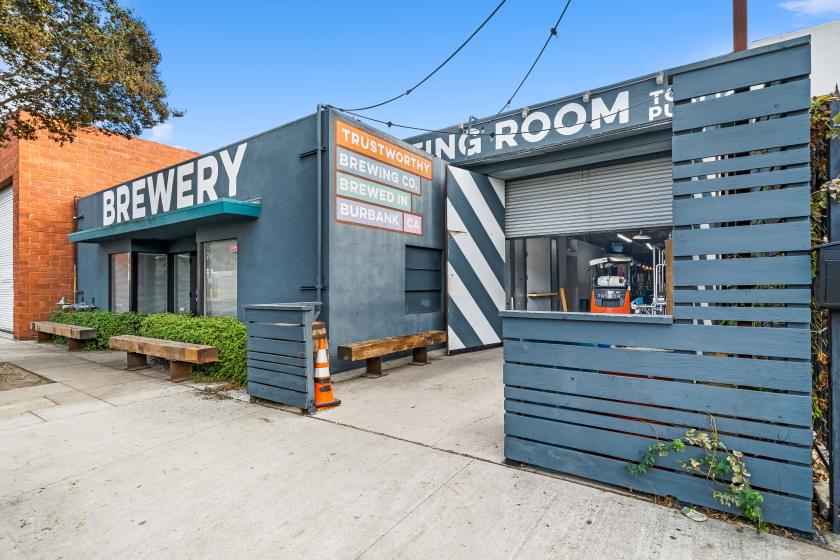
Industrial Properties
156 West Verdugo Avenue Burbank, CA 91502
156 West Verdugo Avenue Burbank, CA 91502

Details & Description
Property Highlights
• Conveniently Located Near Entertainment Studios: Walt Disney, Universal Studios, Warner Bros, Nickelodeon, and more
• Dense Infill Burbank Submarket • Sub 2.50% Market Vacancy Factor & 11.7% YOY Rent Growth
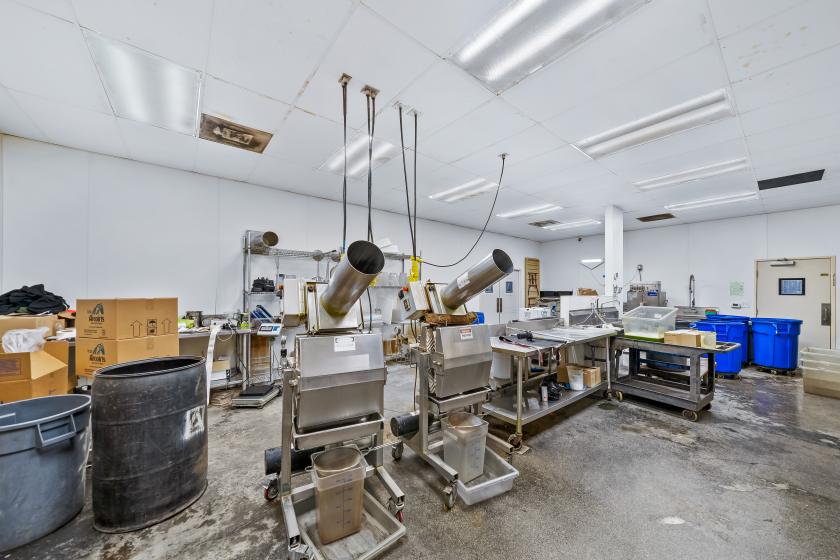
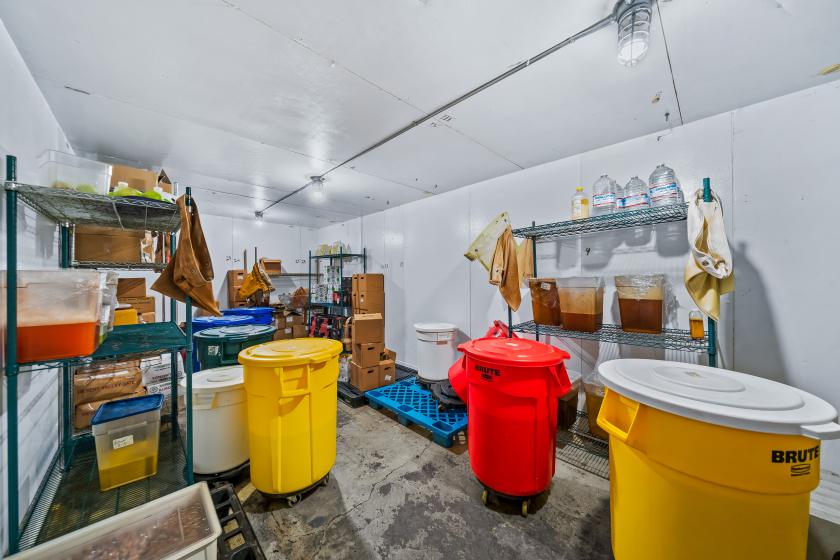
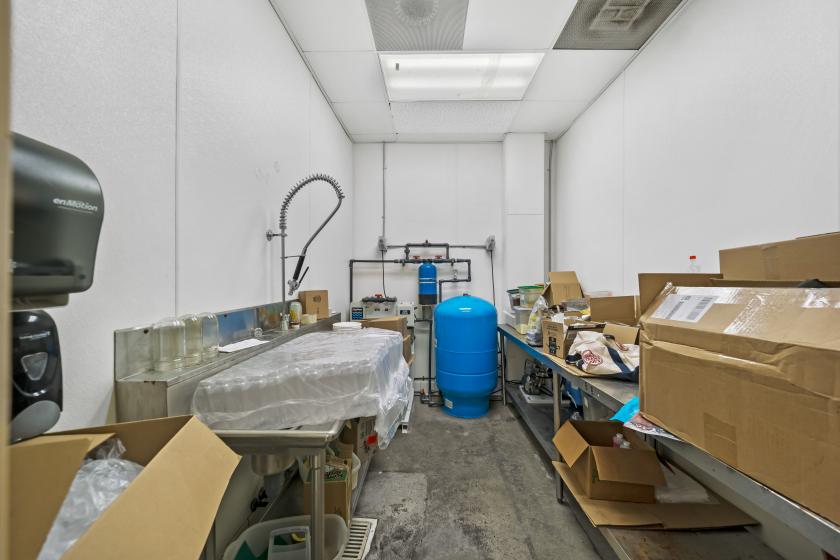
Additional Photos


Listing Agents

Brin Hamblin
O: 818-212-2776
brin.hamblin@marcusmillichap.com
O: 818-212-2776
brin.hamblin@marcusmillichap.com
While we strive to provide the most accurate information, all listing information, and demographic data, is provided by third-parties. As such, MyEListing will not be responsible for the accuracy of the information. It is strongly recommended that you verify all information with the listing agent, and any relevant agencies, prior to making any decisions.