Retail Space
101 Maple Avenue Johnstown, PA 15901
101 Maple Avenue Johnstown, PA 15901

Details & Description
Property Highlights
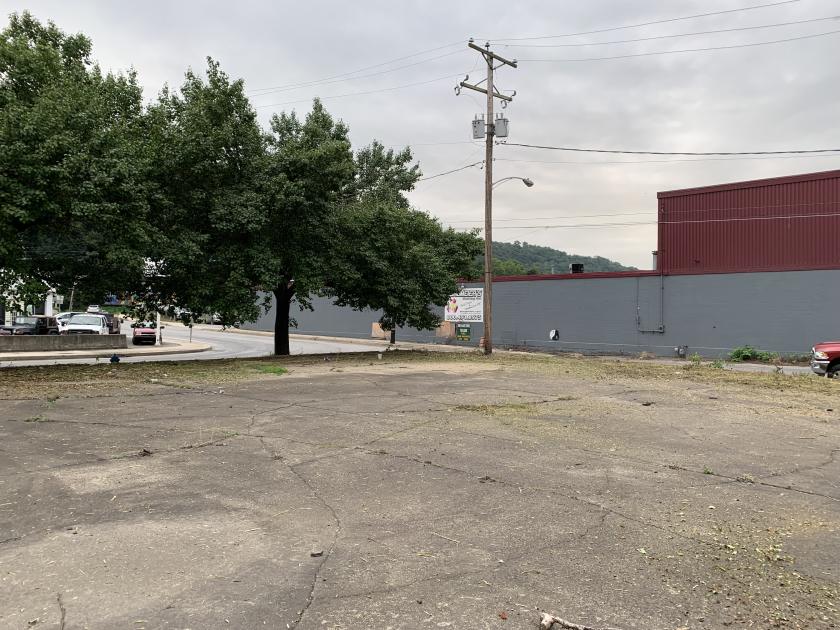
- • Commercial Property ,Corner
- • ON State Highway 271
- • Zoing C2-2
- • High Visible Trafic
Additional Photos


Listing Agents

Tony Gao
bbst8989@gmail.com
bbst8989@gmail.com
While we strive to provide the most accurate information, all listing information, and demographic data, is provided by third-parties. As such, MyEListing will not be responsible for the accuracy of the information. It is strongly recommended that you verify all information with the listing agent, and any relevant agencies, prior to making any decisions.


