Retail Space
1250-1260 East Tallmadge Avenue Akron, OH 44310
1250-1260 East Tallmadge Avenue Akron, OH 44310

Details & Description
Property Highlights
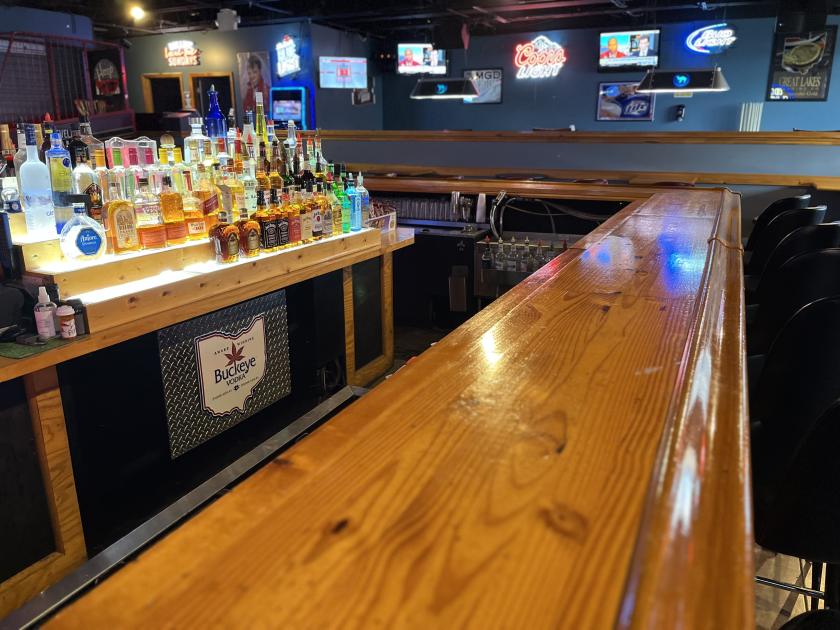
- • Established Bar/Night Club
- • D5 & D6 Liquor License
- • Type C Lottery License
- • Price Reduced - Motivated Seller
Additional Photos


Listing Agents

David Whyte
O: 330-535-2661
M: 303-352-7746
dwhyte@naipvc.com
O: 330-535-2661
M: 303-352-7746
dwhyte@naipvc.com
While we strive to provide the most accurate information, all listing information, and demographic data, is provided by third-parties. As such, MyEListing will not be responsible for the accuracy of the information. It is strongly recommended that you verify all information with the listing agent, and any relevant agencies, prior to making any decisions.


