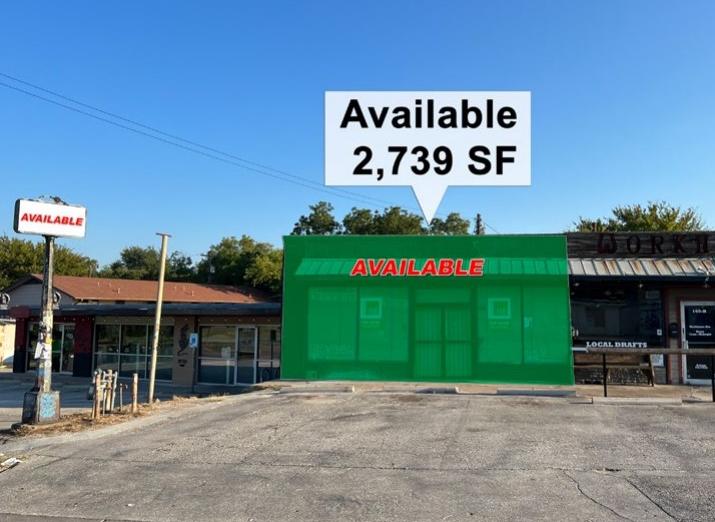
Retail Space
100 North Loop Boulevard East Austin, TX 78751
100 North Loop Boulevard East Austin, TX 78751
Details & Description
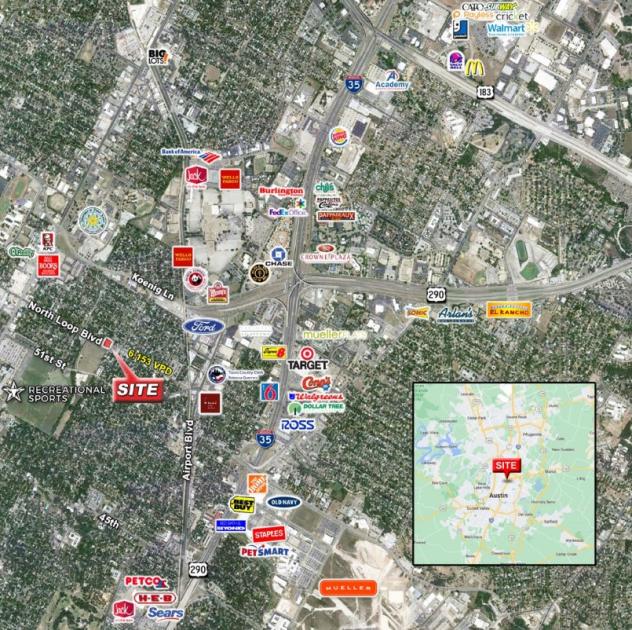
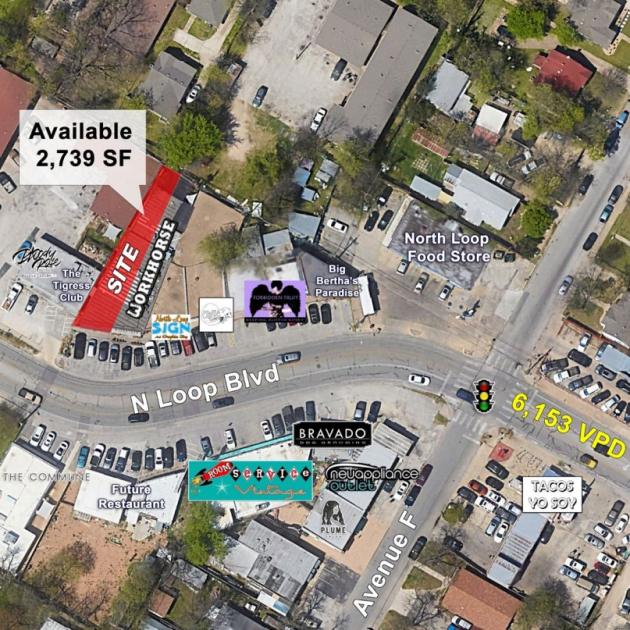
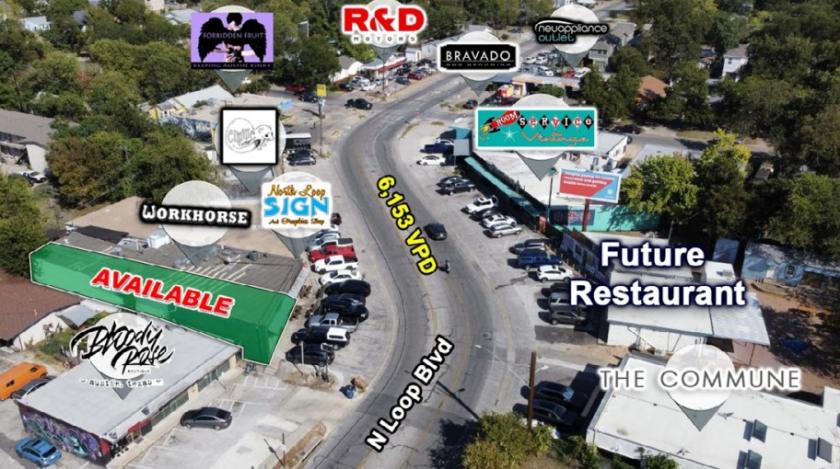
Property Highlights
- • Rare retail opportunity on North Loop Blvd
- • Very walkable retail corridor in Central Austin
- • Only retail vacancy along North Loop Blvd
- • Pylon signage available
Additional Photos
Listing Agents

Tucker Francis
O: 512-474-5557
M: 512-709-8166
tucker@resolutre.com
O: 512-474-5557
M: 512-709-8166
tucker@resolutre.com
While we strive to provide the most accurate information, all listing information, and demographic data, is provided by third-parties. As such, MyEListing will not be responsible for the accuracy of the information. It is strongly recommended that you verify all information with the listing agent, and any relevant agencies, prior to making any decisions.


