Office Space
4366 East Grand River Avenue 5A Howell, MI 48843
4366 East Grand River Avenue 5A Howell, MI 48843

Details & Description
Property Highlights
• Walking distance from restaurants, shopping, hospital
• Busy Grand River area, east of Latson Rd.
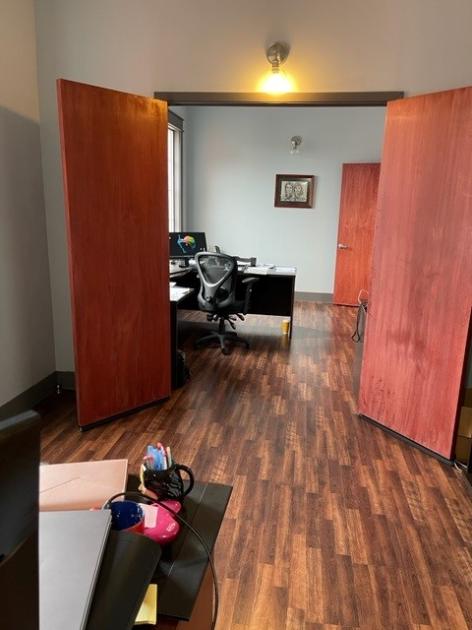
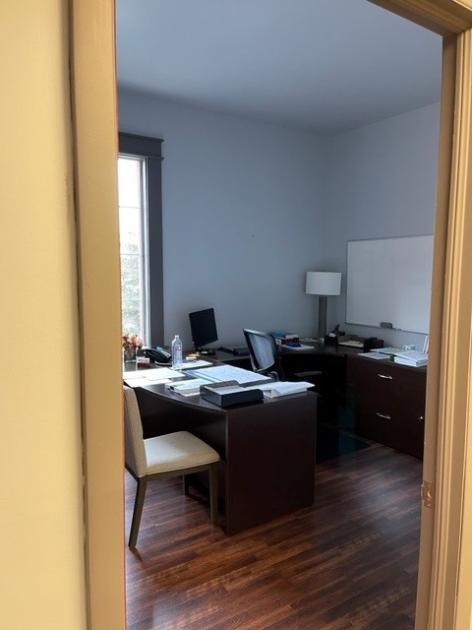
Additional Photos


Listing Agents

Skyler Gardner
skye.gardner@pollicella.net
skye.gardner@pollicella.net
While we strive to provide the most accurate information, all listing information, and demographic data, is provided by third-parties. As such, MyEListing will not be responsible for the accuracy of the information. It is strongly recommended that you verify all information with the listing agent, and any relevant agencies, prior to making any decisions.