Industrial Properties
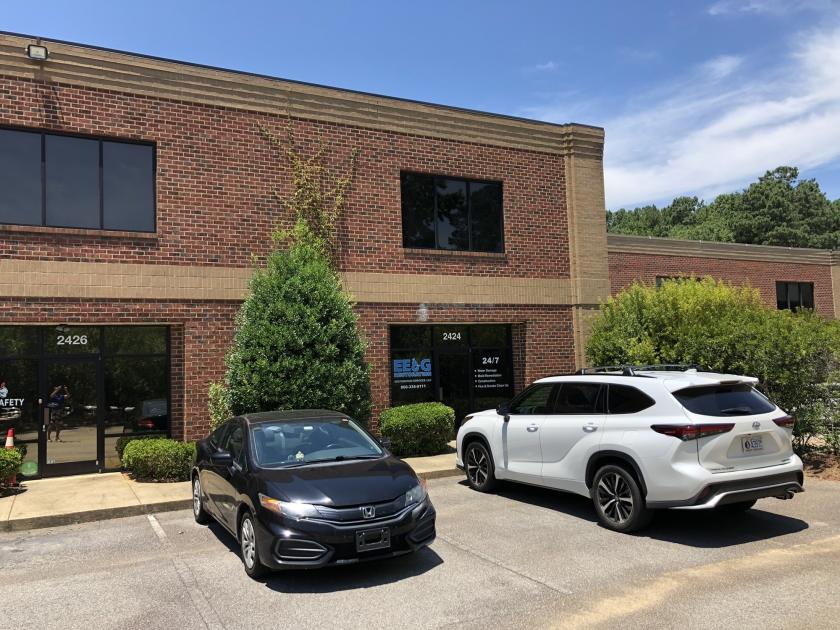
2424 - 2426 Reliance Ave Apex, NC 27539
2424 - 2426 Reliance Ave Apex, NC 27539

Details & Description
Property Highlights
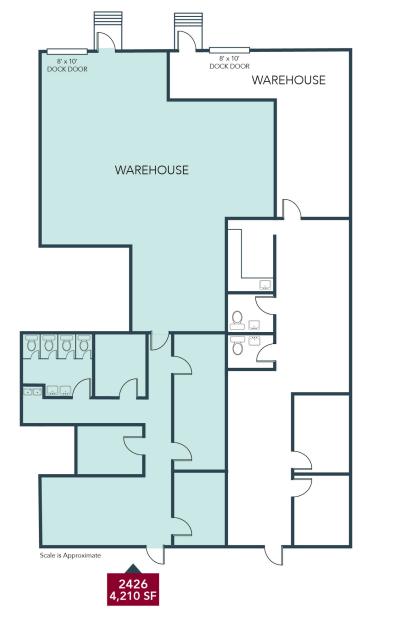
- • 28,181 SF Flex building
- • 1 Dock-high loading door
- • 22’ ceiling height
- • Mix of office/warehouse
- • 3-Phase power
- • Located just off Ten-Ten Road, Near US-1
Listing Agents

Will Judy
O: 919-576-2513
M: 919-606-1956
wjudy@lee-associates.com
O: 919-576-2513
M: 919-606-1956
wjudy@lee-associates.com
While we strive to provide the most accurate information, all listing information, and demographic data, is provided by third-parties. As such, MyEListing will not be responsible for the accuracy of the information. It is strongly recommended that you verify all information with the listing agent, and any relevant agencies, prior to making any decisions.