Commercial Land
Auger Hole Road Haywood, NC 27559
Auger Hole Road Haywood, NC 27559
Details & Description
Property Highlights
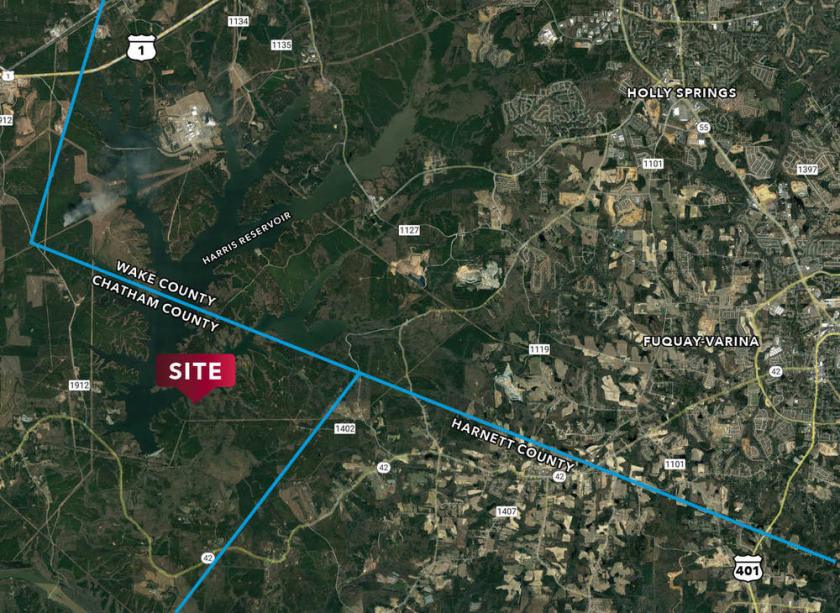
- • ±68.1 acres in southeast Chatham County
- • R-1 zoning
- • No improvements or road infrastructure in place
- • No recorded easement or access agreements
- • Parcels can be purchased separately
Listing Agents

Moss Withers
O: 919-576-2501
M: 919-810-2492
mwithers@lee-associates.com
O: 919-576-2501
M: 919-810-2492
mwithers@lee-associates.com

Karah Jennings McConnell
O: 919-576-2502
M: 919-817-0705
kjennings@lee-associates.com
O: 919-576-2502
M: 919-817-0705
kjennings@lee-associates.com
While we strive to provide the most accurate information, all listing information, and demographic data, is provided by third-parties. As such, MyEListing will not be responsible for the accuracy of the information. It is strongly recommended that you verify all information with the listing agent, and any relevant agencies, prior to making any decisions.


