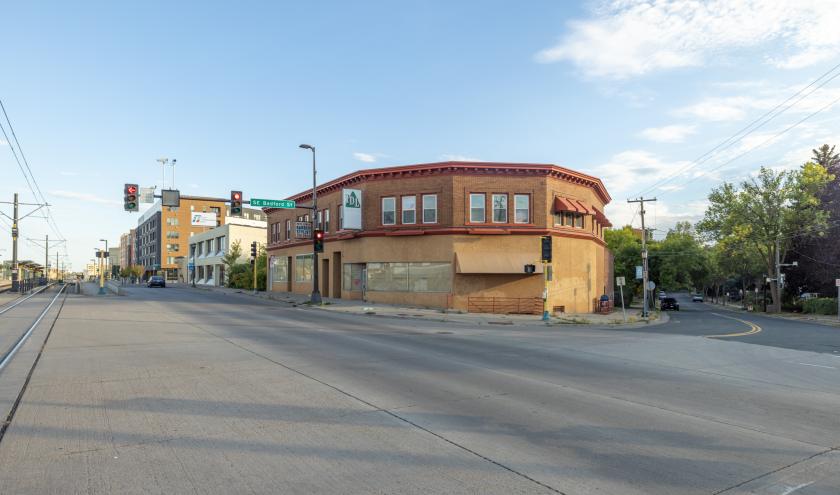
Retail Space
3400 University Avenue Southeast Minneapolis, MN 55414
3400 University Avenue Southeast Minneapolis, MN 55414
Details & Description
Property Highlights
- • Amazing Traffic Counts!
- • Tons of residential households in the area
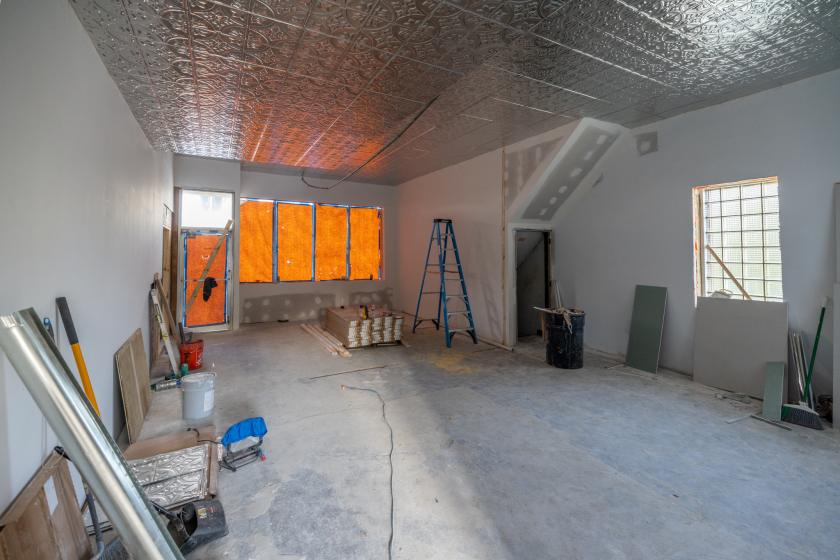
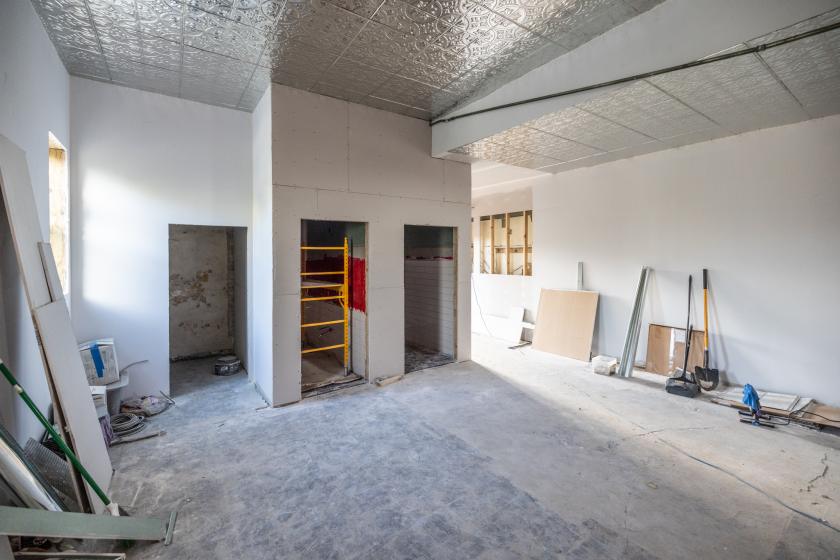
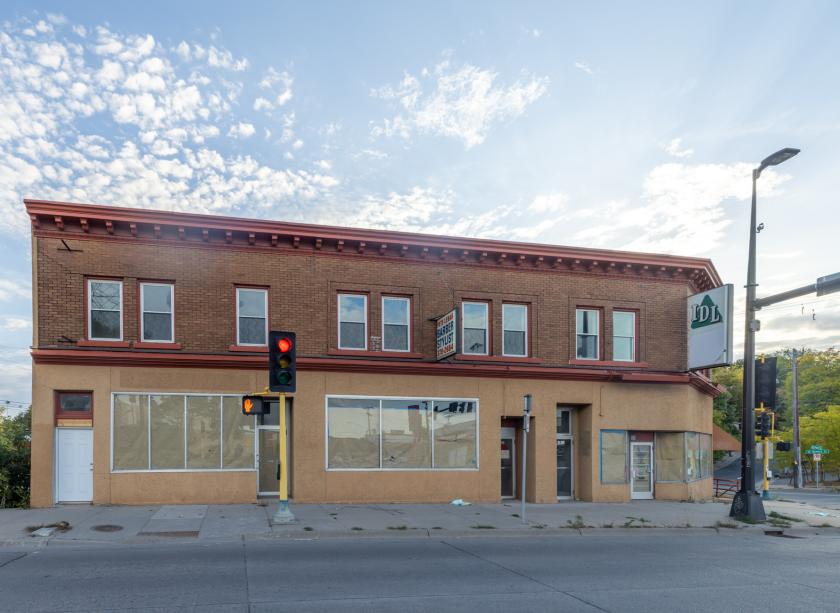
- • Newly renovated mixed use property
- • Strong visibility
- • Off-Street parking in rear of building
Additional Photos


Listing Agents

Chad Heer
The Summit Group of KW Commerc
O: 612-963-5147
summitcregroup@gmail.com
The Summit Group of KW Commerc
O: 612-963-5147
summitcregroup@gmail.com
While we strive to provide the most accurate information, all listing information, and demographic data, is provided by third-parties. As such, MyEListing will not be responsible for the accuracy of the information. It is strongly recommended that you verify all information with the listing agent, and any relevant agencies, prior to making any decisions.