Specialty Real Estate
14300 Ewing Avenue South Burnsville, MN 55306
14300 Ewing Avenue South Burnsville, MN 55306

Details & Description
Property Highlights
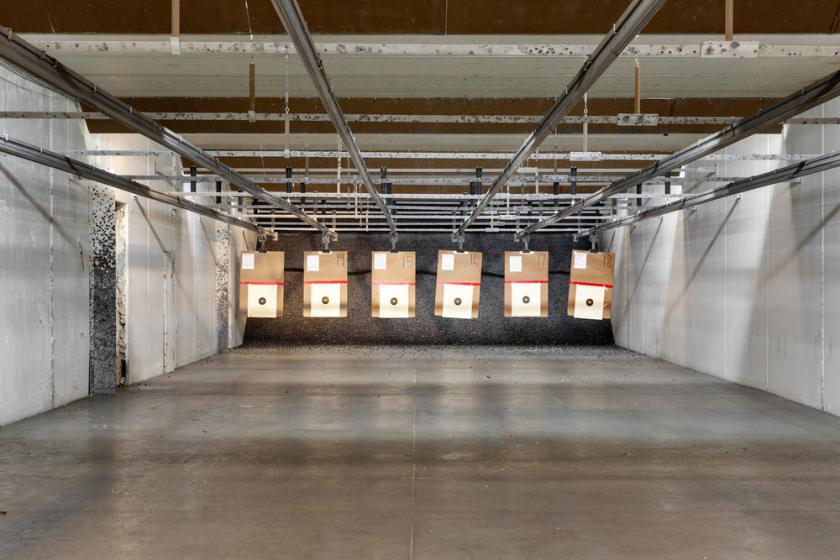
- • State-of-the-art gun range with 18 shooting lanes
- • 28 parking stalls
- • I-3 Industrial Zoning for a variety of uses
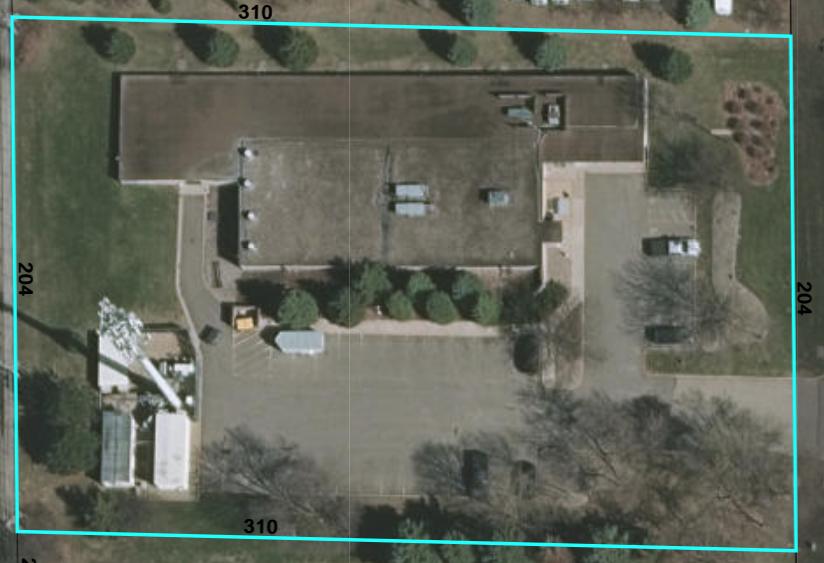
- • 1.453 Acre site
Additional Photos


Listing Agents

Chad Heer
The Summit Group of KW Commerc
O: 612-963-5147
summitcregroup@gmail.com
The Summit Group of KW Commerc
O: 612-963-5147
summitcregroup@gmail.com
While we strive to provide the most accurate information, all listing information, and demographic data, is provided by third-parties. As such, MyEListing will not be responsible for the accuracy of the information. It is strongly recommended that you verify all information with the listing agent, and any relevant agencies, prior to making any decisions.