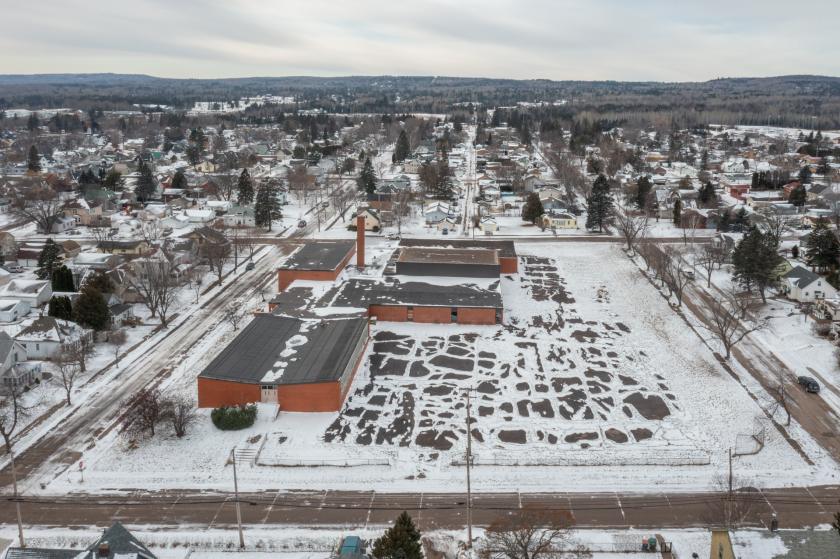
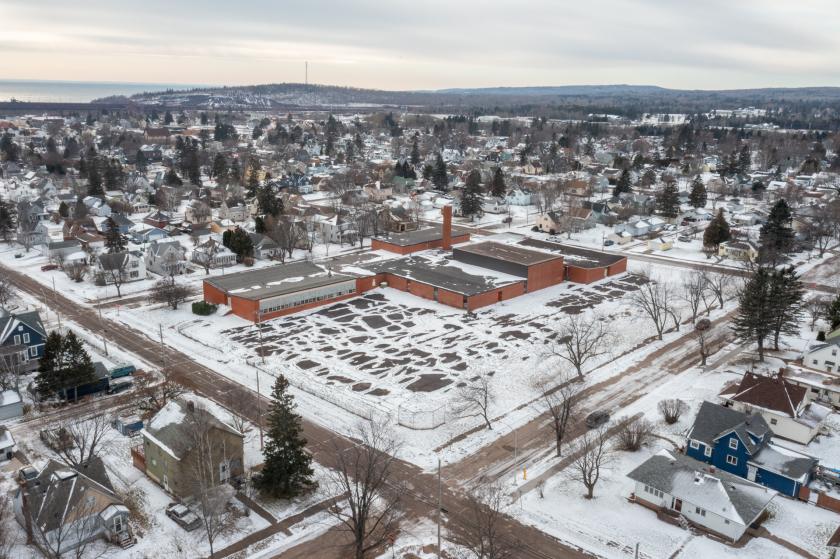
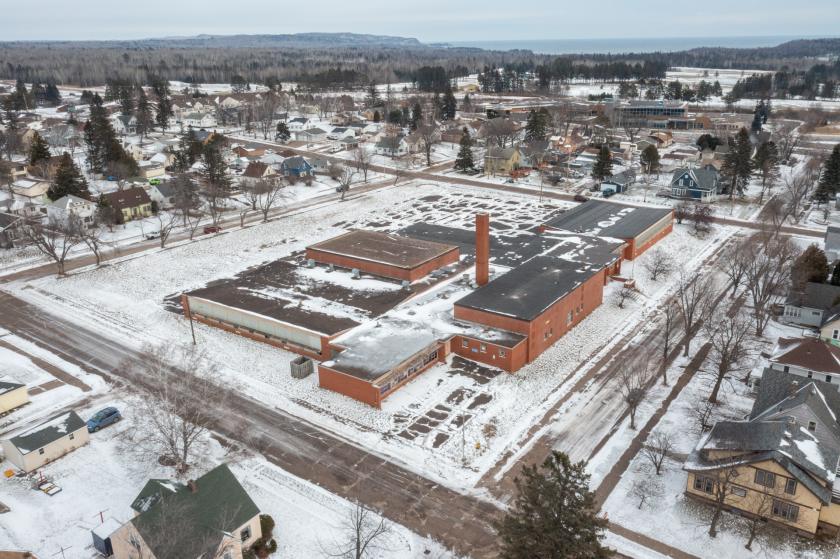
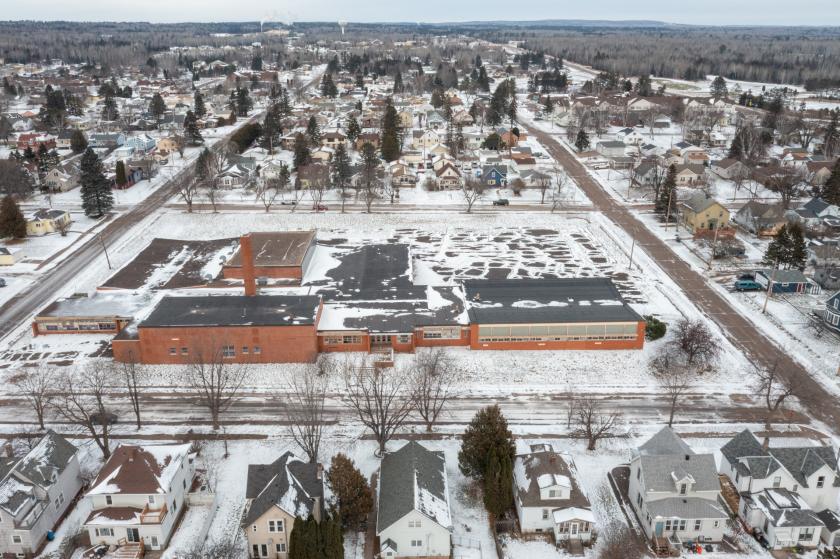
Commercial Land
515 10th Avenue Two Harbors, MN 55616
515 10th Avenue Two Harbors, MN 55616

Details & Description
Property Highlights
- • 2.5 Acres
- • NO ACCESS to building (Redevelopment only)
- • Aerial tour available
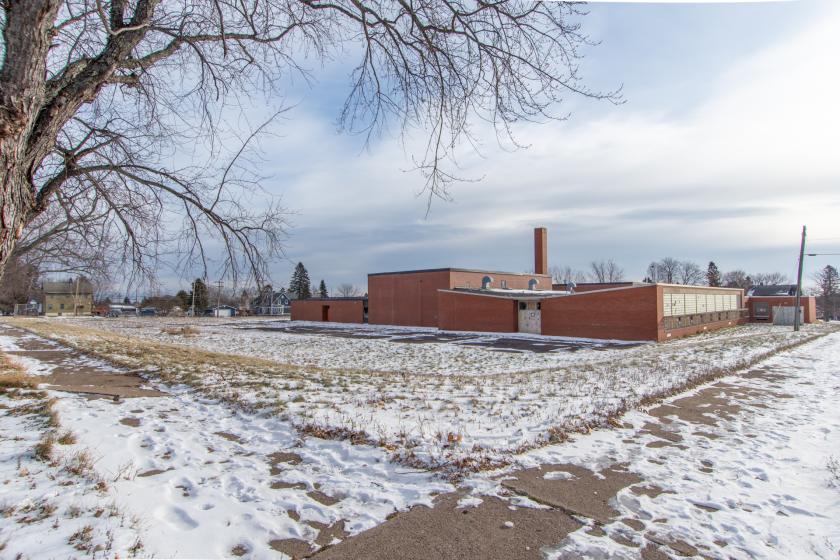
Additional Photos


Listing Agents

Chad Heer
The Summit Group of KW Commerc
O: 612-963-5147
summitcregroup@gmail.com
The Summit Group of KW Commerc
O: 612-963-5147
summitcregroup@gmail.com
While we strive to provide the most accurate information, all listing information, and demographic data, is provided by third-parties. As such, MyEListing will not be responsible for the accuracy of the information. It is strongly recommended that you verify all information with the listing agent, and any relevant agencies, prior to making any decisions.