Retail Space
6100 Rogers Road Rolesville, NC 27571
6100 Rogers Road Rolesville, NC 27571
Details & Description
Property Highlights
• Convenient to Thales Academy, Rolesville Elementary School, and the US Post Office
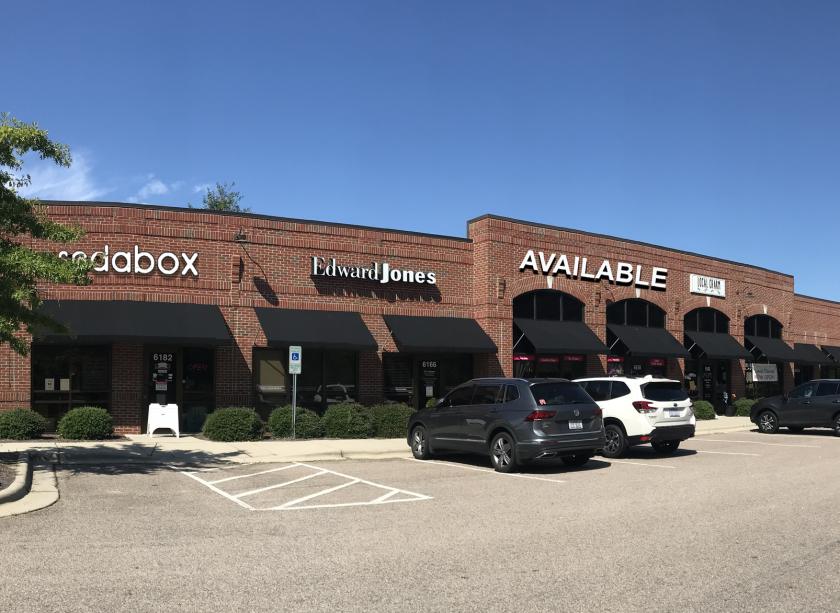
• Retail center for lease in Rolesville, NC
Listing Agents

Jenn Olevitch-Roberson
O: 919-576-2517
M: 919-345-1752
jolevitch-roberson@lee-associates.com
O: 919-576-2517
M: 919-345-1752
jolevitch-roberson@lee-associates.com
While we strive to provide the most accurate information, all listing information, and demographic data, is provided by third-parties. As such, MyEListing will not be responsible for the accuracy of the information. It is strongly recommended that you verify all information with the listing agent, and any relevant agencies, prior to making any decisions.


