Industrial Properties
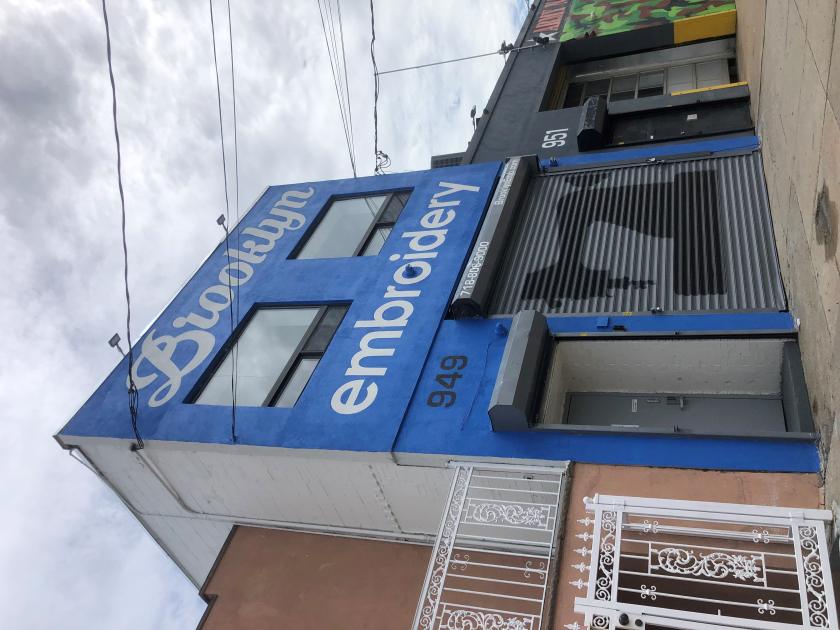
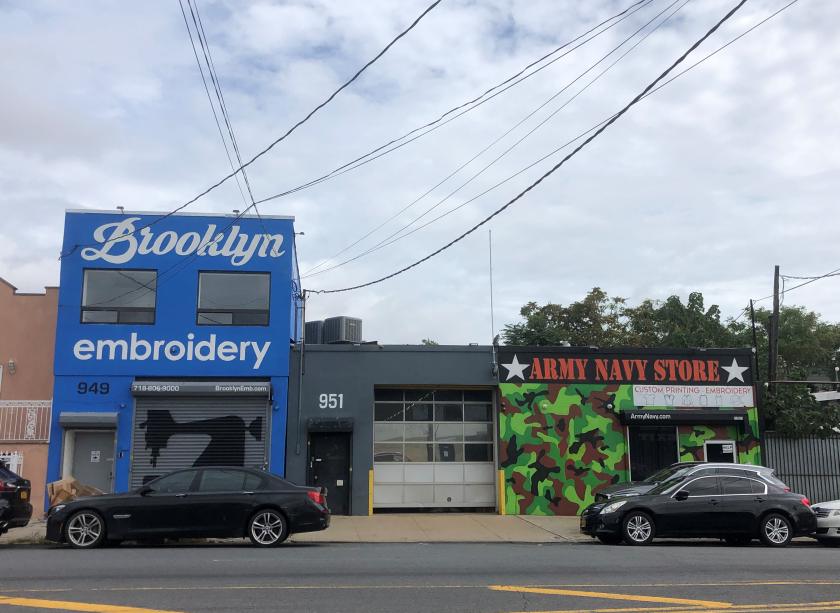
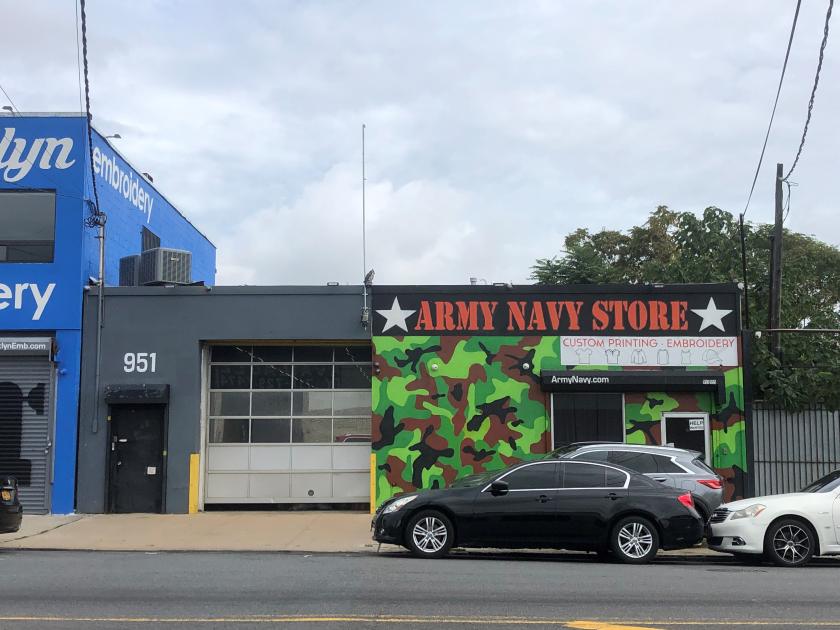
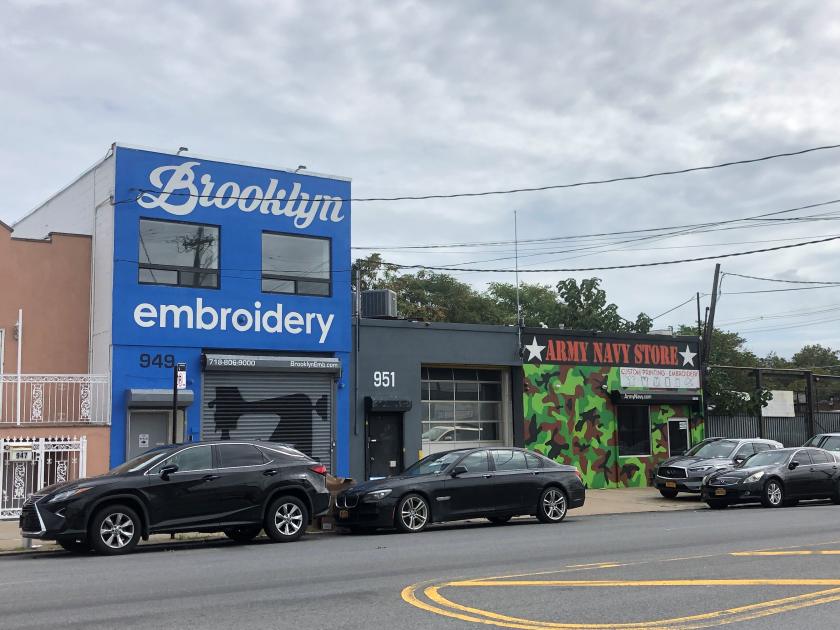
949-951 Remsen Avenue Brooklyn, NY 11236
949-951 Remsen Avenue Brooklyn, NY 11236
Details & Description
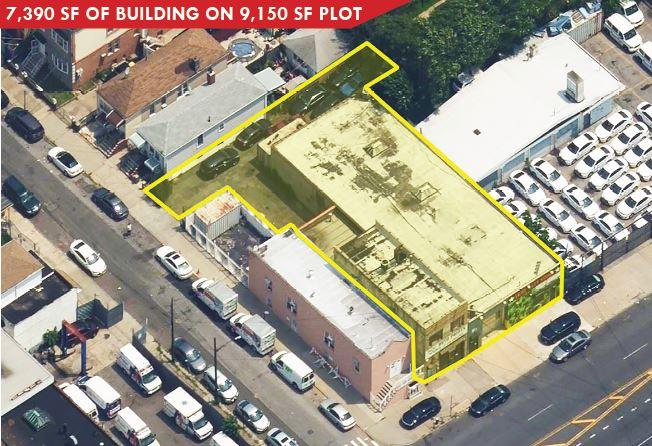
Property Highlights
- • 3 parcel asemblage
- • Warehouse - Office - Parking
- • Recent renovation
- • Industrial zoning
- • Double wide street
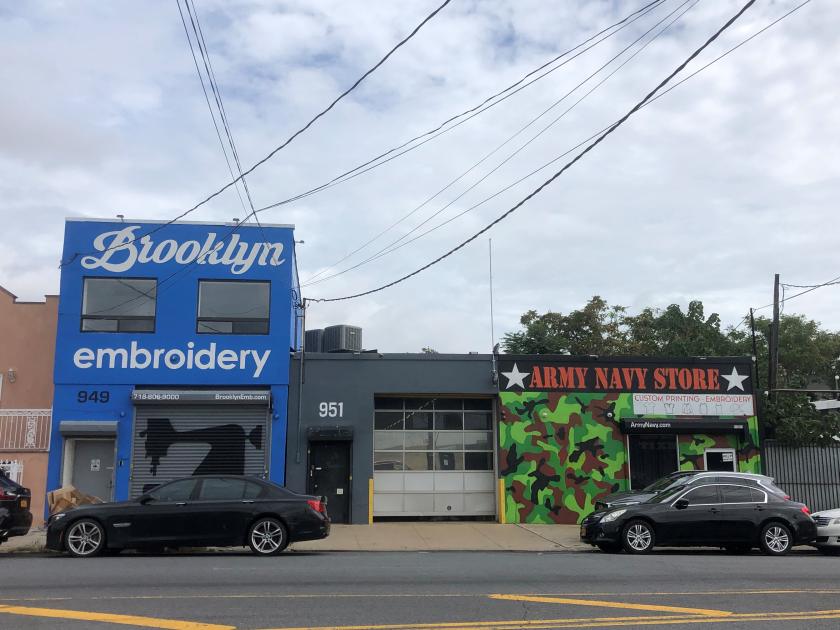
Additional Photos
Listing Agents

Kris Jimenez
O: 718-729-7474
M: 347-865-2945
kjimenez@dyrealty.com
O: 718-729-7474
M: 347-865-2945
kjimenez@dyrealty.com
While we strive to provide the most accurate information, all listing information, and demographic data, is provided by third-parties. As such, MyEListing will not be responsible for the accuracy of the information. It is strongly recommended that you verify all information with the listing agent, and any relevant agencies, prior to making any decisions.