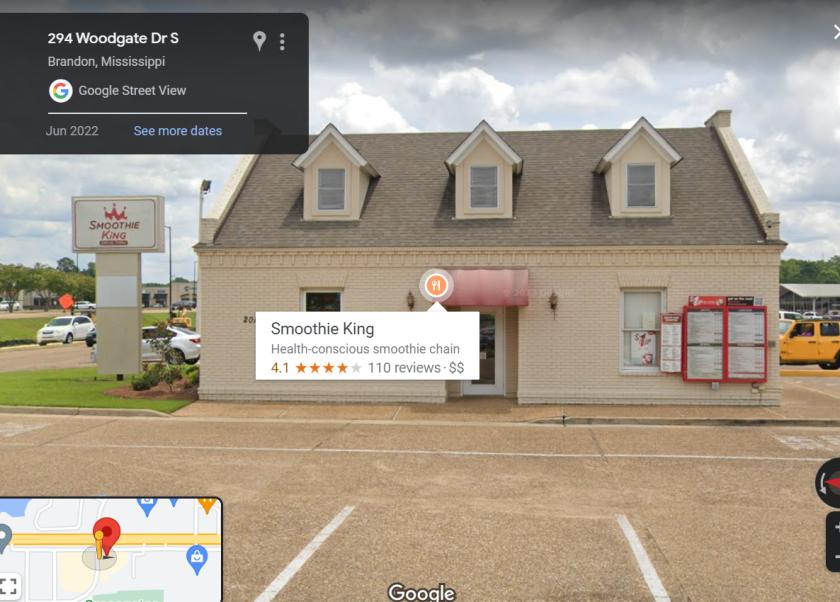
1-Mile | 3-Miles | 5-Miles | ||
---|---|---|---|---|
Total Population | 2,946 | 23,947 | 56,737 | |
Population Median Age | 44 | 40 | 39 | |
Population by Age | 0-9 Yrs | 400 (13%) | 2950 (12%) | 6998 (12%) |
10-19 Yrs | 189 (6%) | 2986 (12%) | 7217 (12%) | |
20-29 Yrs | 434 (14%) | 3038 (12%) | 6993 (12%) | |
30-39 Yrs | 307 (10%) | 3215 (13%) | 8523 (15%) | |
40-49 Yrs | 286 (9%) | 2881 (12%) | 7536 (13%) | |
50-59 Yrs | 341 (11%) | 2870 (11%) | 6651 (11%) | |
60-69 Yrs | 403 (13%) | 2970 (12%) | 6952 (12%) | |
70+ Yrs | 585 (19%) | 3038 (12%) | 5866 (10%) | |
Median HH Income | $64,855 | $74,599 | $77,625 | |
Total Household Income | < 24K | 189 (14%) | 782 (8%) | 2047 (10%) |
25-49K | 286 (22%) | 1945 (21%) | 3715 (18%) | |
50-74K | 276 (21%) | 1783 (19%) | 3756 (18%) | |
75-99K | 243 (18%) | 1672 (18%) | 3566 (18%) | |
100-199K | 211 (16%) | 2410 (26%) | 5519 (27%) | |
200K+ | 89 (6%) | 373 (4%) | 1182 (5%) | |
Highest Education Level | No Diploma | 81 | 1255 | 3747 |
Diploma or GED | 390 | 3903 | 8932 | |
Some College | 414 | 4106 | 9252 | |
Assoc. Degree | 205 | 1477 | 3995 | |
Bachelors Degree | 659 | 4290 | 8741 | |
Higher Degree | 386 | 1855 | 5143 | |
Total Housing Units | 1,376 | 9,509 | 21,144 | |
--Owner-Occupied | 907 | 6,714 | 15,238 | |
--Renter-Occupied | 387 | 2,250 | 4,547 | |
Owner-Occupied Values | < 100K | 40 | 674 | 1726 |
100-199K | 641 | 3553 | 6982 | |
200-299K | 170 | 1752 | 4130 | |
300-399K | 31 | 473 | 1337 | |
400-499K | 2 | 127 | 499 | |
500K+ | 24 | 136 | 564 | |
Total Working Age Population | 2,444 | 19,416 | 45,598 | |
In Work Force | 1,537 | 12,607 | 28,268 | |
Not In Work Force | 907 | 6,808 | 17,329 | |
Workforce Employed | 1,506 | 11,859 | 26,810 | |
Workforce Unemployed | 28 | 684 | 1,311 | |
Civlian Workforce | 1,534 | 12,543 | 28,121 | |
Military Workforce | 3 | 64 | 147 | |
Total Households | 1,294 | 8,965 | 19,785 | |
Family Households | 841 | 6,478 | 14,277 | |
Non-Family Households | 453 | 2,487 | 5,508 | |
Married Couple | 625 | 5,001 | 11,230 | |
Other Family | 216 | 1,477 | 3,047 | |
Married w/Child | 156 | 1,665 | 4,231 | |
Single Male w/Child | 46 | 257 | 327 | |
Single Female w/Child | 54 | 522 | 1,330 |
Population Change Last Two Decades - Plus Projection
2000 | % | 2010 | % | 2020 | % | 2030 | |
---|---|---|---|---|---|---|---|
Mississippi | 2,844,658 | +4 | 2,967,297 | +3 | 3,066,382 | +1 | 3,104,159 |
Rankin County | 115,327 | +23 | 141,617 | +12 | 158,225 | +1 | 160,175 |
Total Working Age Population:
Total Households:
Total Working Age Population:
Total Households:
Total Working Age Population:
Total Households: