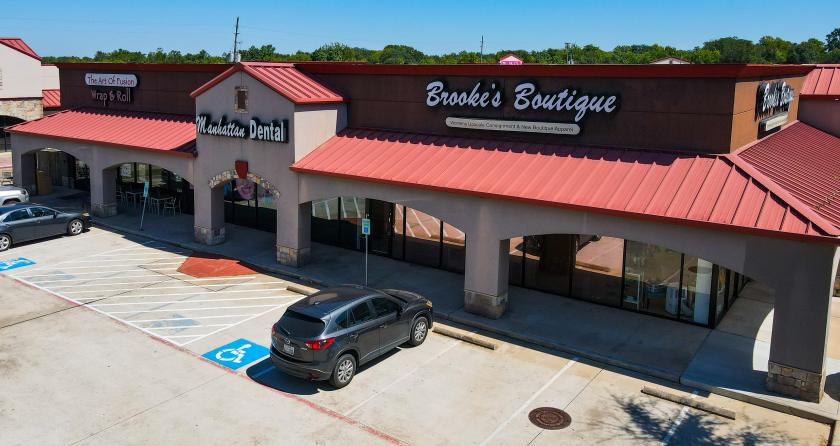
Retail Space
8201 Broadway Street Pearland, TX 77581
8201 Broadway Street Pearland, TX 77581

Details & Description
Property Highlights
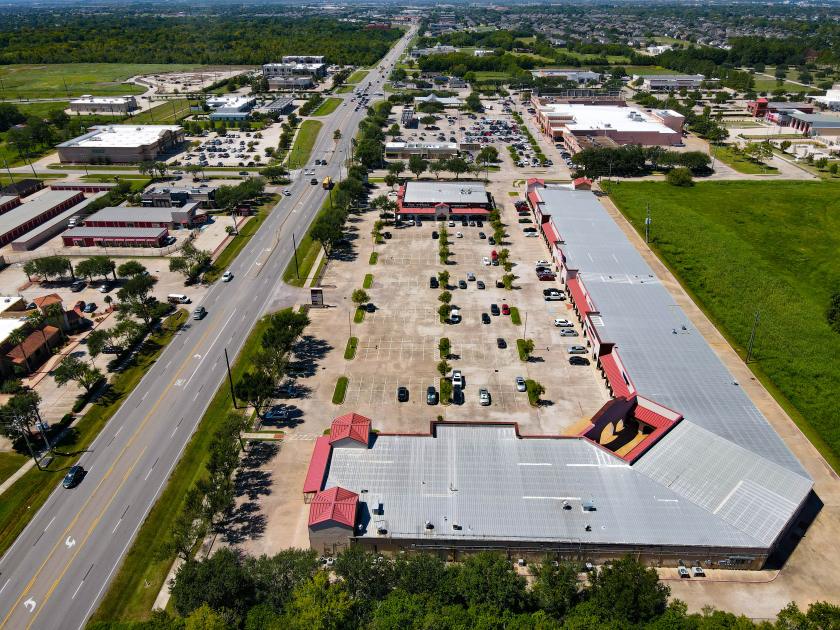
- • Grocery shadow-anchored by Kroger and Sprouts
- • Easy access with multiple entry and exit points
- • Two Top 5 Rated Restaurants - Best in Pearland
Additional Photos


Listing Agents

Ryan Dennard
O: 713-885-2371
rdennard@crisscrosscg.com
O: 713-885-2371
rdennard@crisscrosscg.com
While we strive to provide the most accurate information, all listing information, and demographic data, is provided by third-parties. As such, MyEListing will not be responsible for the accuracy of the information. It is strongly recommended that you verify all information with the listing agent, and any relevant agencies, prior to making any decisions.