Flex-Office-Warehouse
5150 McCrimmon Parkway Morrisville, NC 27560
5150 McCrimmon Parkway Morrisville, NC 27560

Details & Description
Property Highlights
- • Can accommodate 7 dock doors
- • Master lease expiration: 11/15/23
- • Above market 8.0/1,000 SF parking ratio
- • Lease rate negotiable
- • TICAM: $3.29/SF
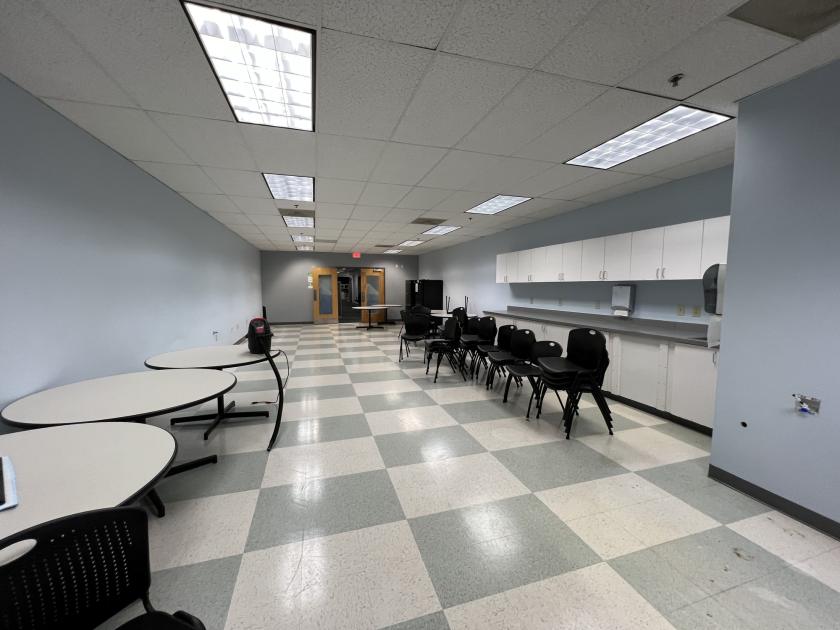
Additional Photos


Listing Agents

Brian Farmer
O: 919-576-2503
M: 919-730-6584
bfarmer@lee-associates.com
O: 919-576-2503
M: 919-730-6584
bfarmer@lee-associates.com
While we strive to provide the most accurate information, all listing information, and demographic data, is provided by third-parties. As such, MyEListing will not be responsible for the accuracy of the information. It is strongly recommended that you verify all information with the listing agent, and any relevant agencies, prior to making any decisions.


