Industrial Properties
7270 114th Avenue Largo, FL 33773
7270 114th Avenue Largo, FL 33773

Details & Description
Property Highlights
- • 2,400 sf condo unit.
- • Fully Air Conditioned.
- • 1 12'x14' Grade Level Door.
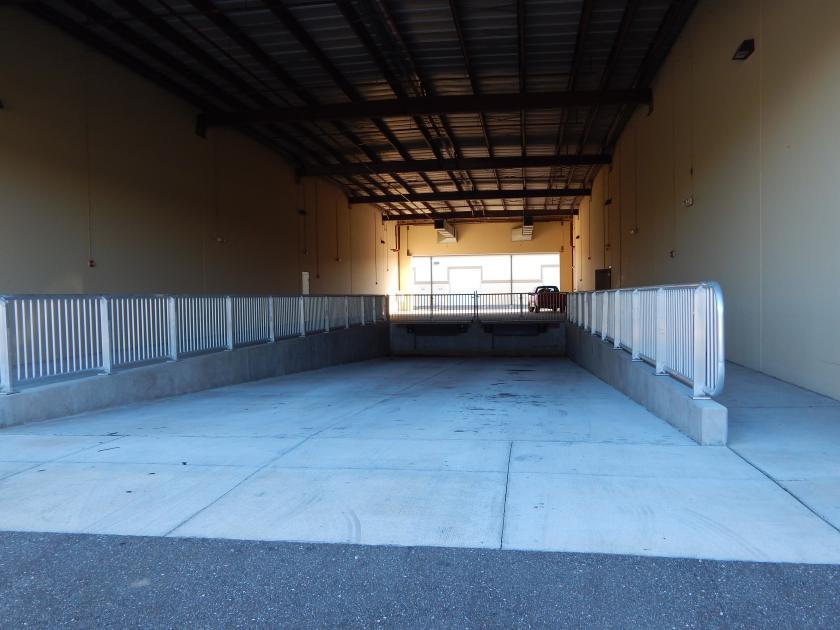
- • 18-20' clear height.
- • Pinellas Park M-1 Zoning.
- • Concrete tilt wall construction.
Additional Photos


Listing Agents

Jeff Clapacs
O: 727-822-4715
M: 813-833-0788
jeff@cprteam.com
O: 727-822-4715
M: 813-833-0788
jeff@cprteam.com
While we strive to provide the most accurate information, all listing information, and demographic data, is provided by third-parties. As such, MyEListing will not be responsible for the accuracy of the information. It is strongly recommended that you verify all information with the listing agent, and any relevant agencies, prior to making any decisions.


