Office Space
3205 Westside Park CT Mobile, AL 36695
3205 Westside Park CT Mobile, AL 36695

Details & Description
Property Highlights
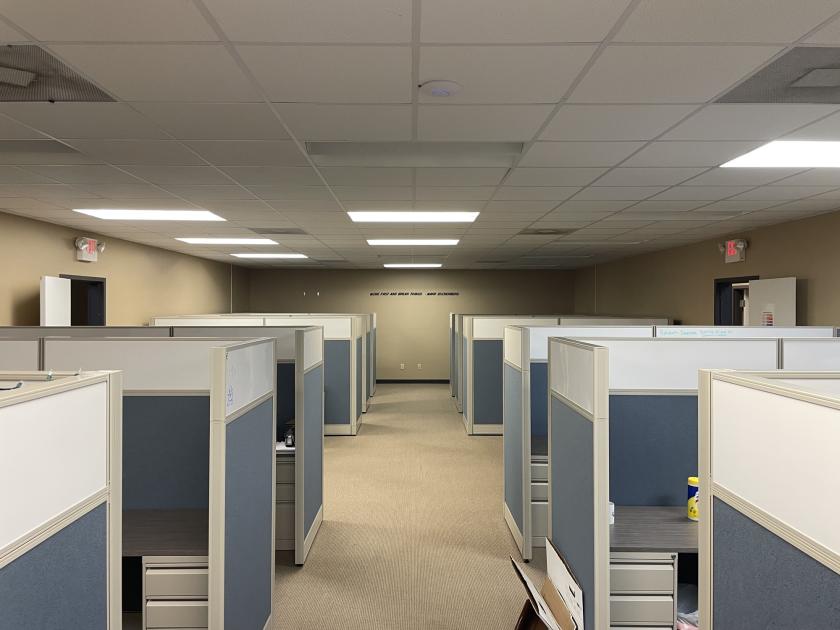
- • 30+ private offices
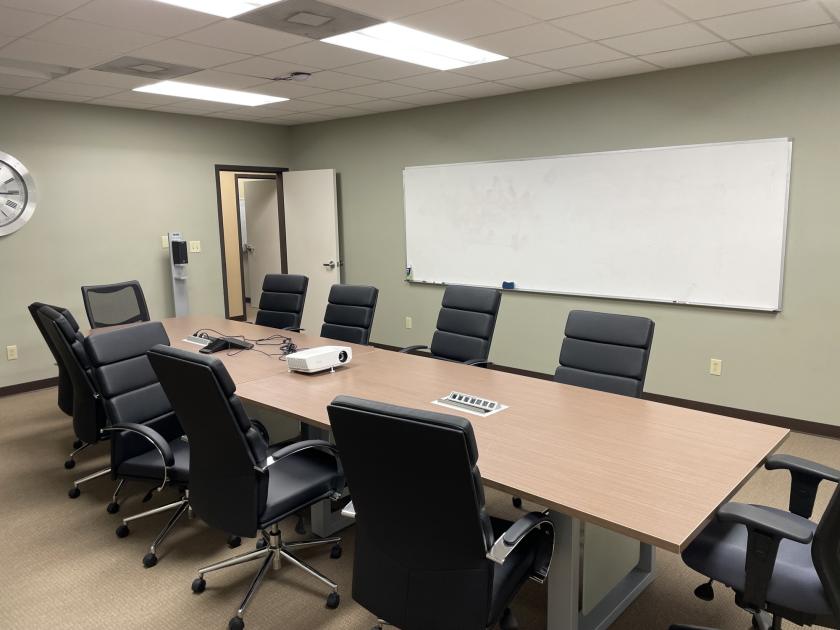
- • Several conference rooms
- • Kitchen/break room
- • Server Room
Additional Photos


Listing Agents

Sharon Wright
M: 251-510-1822
sharon@white-spunnerrealty.com
M: 251-510-1822
sharon@white-spunnerrealty.com

Chris Harle
M: 251-234-7232
chris@white-spunnerrealty.com
M: 251-234-7232
chris@white-spunnerrealty.com
While we strive to provide the most accurate information, all listing information, and demographic data, is provided by third-parties. As such, MyEListing will not be responsible for the accuracy of the information. It is strongly recommended that you verify all information with the listing agent, and any relevant agencies, prior to making any decisions.


