Commercial Land
1386 Dawes Rd Mobile, AL 36695
1386 Dawes Rd Mobile, AL 36695

Details & Description
Property Highlights
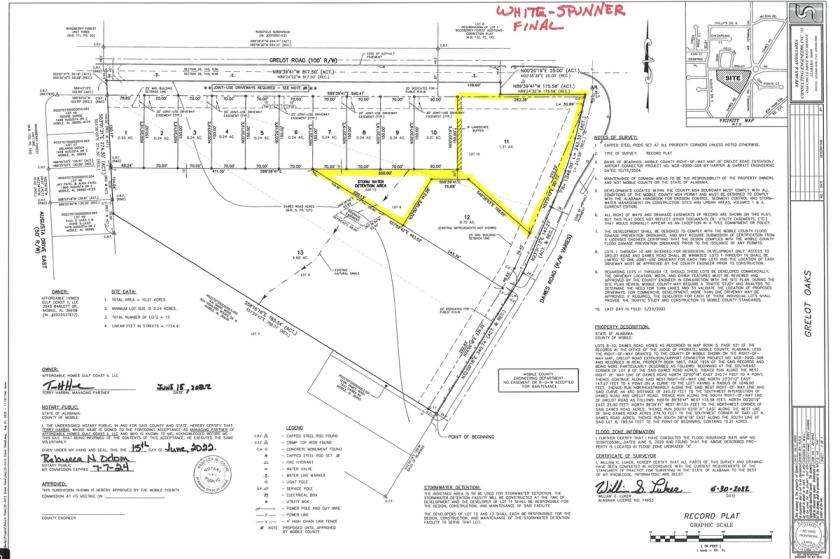
• Great corner with many commercial type possibilities
• Easy access to Mobile Regional Airport
Listing Agents

Sharon Wright
M: 251-510-1822
sharon@white-spunnerrealty.com
M: 251-510-1822
sharon@white-spunnerrealty.com

Matt White
M: 251-377-3033
matt@white-spunnerrealty.com
M: 251-377-3033
matt@white-spunnerrealty.com
While we strive to provide the most accurate information, all listing information, and demographic data, is provided by third-parties. As such, MyEListing will not be responsible for the accuracy of the information. It is strongly recommended that you verify all information with the listing agent, and any relevant agencies, prior to making any decisions.