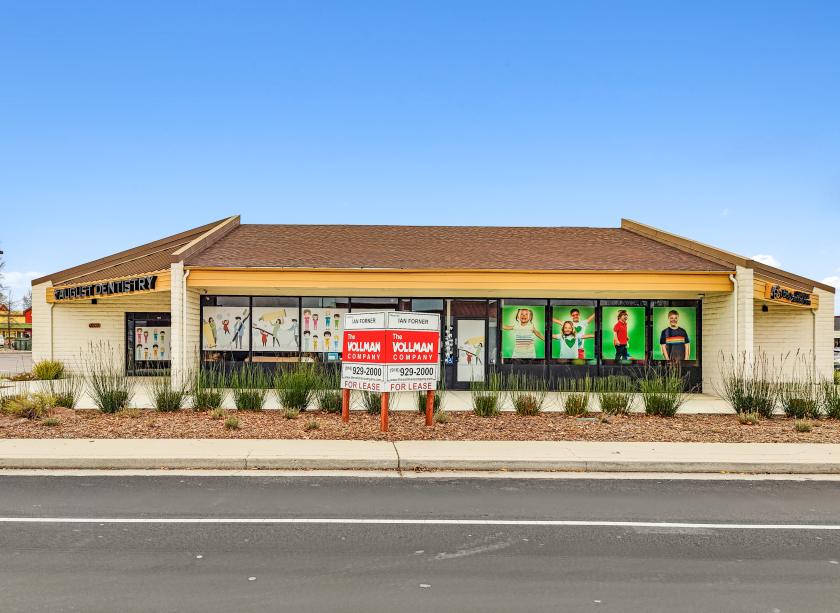
1-Mile | 3-Miles | 5-Miles | ||
---|---|---|---|---|
Total Population | 9,874 | 103,533 | 268,808 | |
Population Median Age | 42 | 40 | 39 | |
Population by Age | 0-9 Yrs | 1340 (13%) | 11135 (10%) | 30013 (11%) |
10-19 Yrs | 809 (8%) | 12934 (12%) | 36459 (13%) | |
20-29 Yrs | 1152 (11%) | 14299 (13%) | 35403 (13%) | |
30-39 Yrs | 1439 (14%) | 14390 (13%) | 36605 (13%) | |
40-49 Yrs | 1139 (11%) | 13168 (12%) | 34486 (12%) | |
50-59 Yrs | 1172 (11%) | 14560 (14%) | 37476 (13%) | |
60-69 Yrs | 1125 (11%) | 11842 (11%) | 30184 (11%) | |
70+ Yrs | 1699 (17%) | 11206 (10%) | 28182 (10%) | |
Median HH Income | $66,250 | $81,778 | $84,846 | |
Total Household Income | < 24K | 857 (20%) | 5205 (13%) | 11711 (11%) |
25-49K | 752 (18%) | 6431 (16%) | 15706 (15%) | |
50-74K | 725 (17%) | 6729 (16%) | 16870 (16%) | |
75-99K | 491 (11%) | 5929 (14%) | 13835 (13%) | |
100-199K | 1058 (25%) | 11379 (28%) | 29753 (29%) | |
200K+ | 293 (7%) | 4271 (10%) | 11598 (11%) | |
Highest Education Level | No Diploma | 529 | 4304 | 11408 |
Diploma or GED | 1661 | 13415 | 35686 | |
Some College | 2113 | 19916 | 50608 | |
Assoc. Degree | 956 | 7899 | 20682 | |
Bachelors Degree | 1417 | 18796 | 46187 | |
Higher Degree | 673 | 8618 | 21454 | |
Total Housing Units | 4,469 | 41,808 | 103,258 | |
--Owner-Occupied | 2,054 | 24,178 | 65,174 | |
--Renter-Occupied | 2,122 | 15,766 | 34,300 | |
Owner-Occupied Values | < 100K | 74 | 913 | 2562 |
100-199K | 111 | 932 | 1882 | |
200-299K | 232 | 2671 | 7309 | |
300-399K | 688 | 6694 | 17856 | |
400-499K | 419 | 5240 | 14578 | |
500K+ | 531 | 7727 | 20987 | |
Total Working Age Population | 7,975 | 84,230 | 216,581 | |
In Work Force | 4,683 | 54,362 | 139,718 | |
Not In Work Force | 3,292 | 29,868 | 76,862 | |
Workforce Employed | 4,496 | 51,518 | 131,926 | |
Workforce Unemployed | 180 | 2,760 | 7,260 | |
Civlian Workforce | 4,676 | 54,278 | 139,186 | |
Military Workforce | 6 | 85 | 532 | |
Total Households | 4,177 | 39,944 | 99,474 | |
Family Households | 2,345 | 26,208 | 68,419 | |
Non-Family Households | 1,832 | 13,736 | 31,055 | |
Married Couple | 1,766 | 19,799 | 52,773 | |
Other Family | 578 | 6,409 | 15,646 | |
Married w/Child | 762 | 8,016 | 22,489 | |
Single Male w/Child | 71 | 1,000 | 2,544 | |
Single Female w/Child | 198 | 2,134 | 5,161 |
Population Change Last Two Decades - Plus Projection
2000 | % | 2010 | % | 2020 | % | 2030 | |
---|---|---|---|---|---|---|---|
California | 33,871,648 | +10 | 37,253,956 | +9 | 40,467,295 | +8 | 43,631,295 |
Sacramento County | 1,223,499 | +16 | 1,418,788 | +11 | 1,572,195 | +12 | 1,758,565 |
Placer County | 248,399 | +40 | 348,432 | +15 | 399,388 | +14 | 456,175 |
Total Working Age Population:
Total Households:
Total Working Age Population:
Total Households:
Total Working Age Population:
Total Households: