Retail Space
5629 Madison Road Cincinnati, OH 45227
5629 Madison Road Cincinnati, OH 45227

Details & Description
Property Highlights
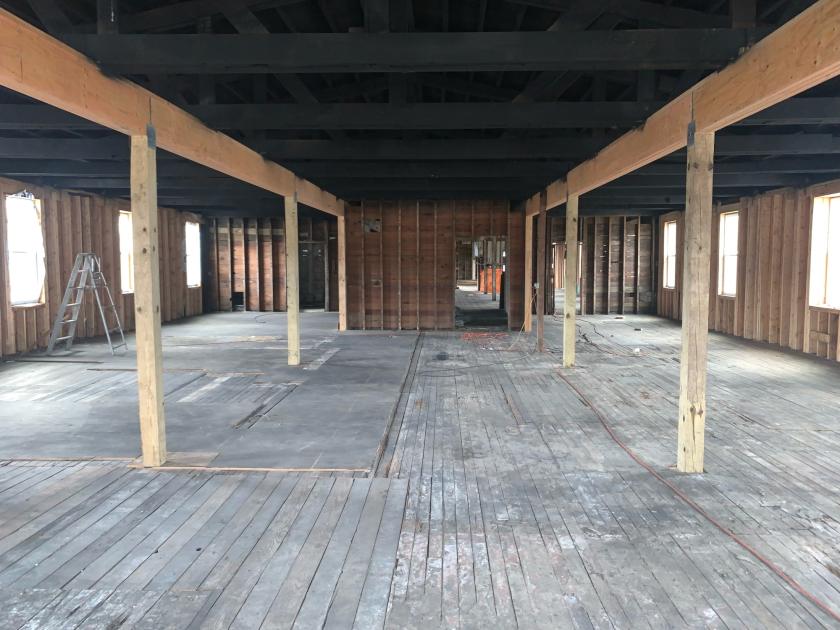
- • Value Add Investment Opportunity
- • Multi Family and Mixed Use Capabilities
- • Extremely High Ceilings on All Three Floors
- • Lower Level with Useable Square Footage
- • Easy Access to Interstate 71
- • Approximately 33,000 VPD
Additional Photos


Listing Agents

Matt Hiudt
O: 513-322-6310
M: 513-479-2050
mhiudt@bergmancommercial.com
O: 513-322-6310
M: 513-479-2050
mhiudt@bergmancommercial.com
While we strive to provide the most accurate information, all listing information, and demographic data, is provided by third-parties. As such, MyEListing will not be responsible for the accuracy of the information. It is strongly recommended that you verify all information with the listing agent, and any relevant agencies, prior to making any decisions.


