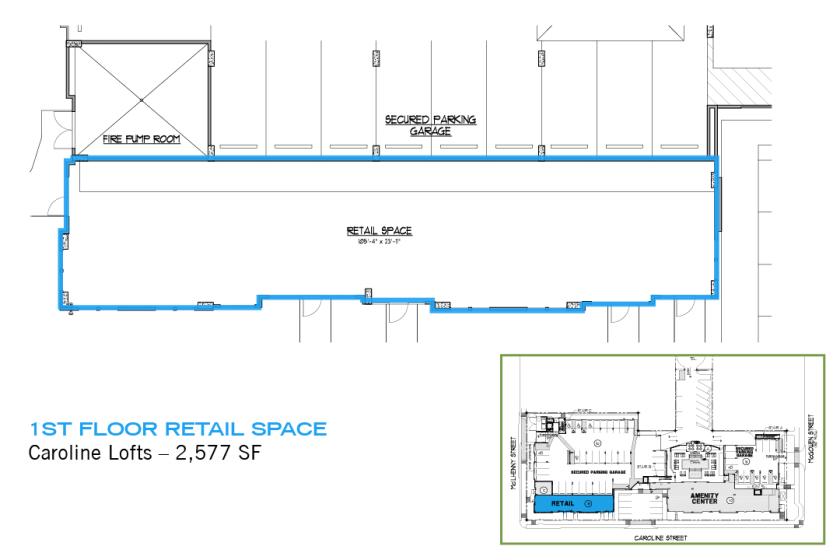
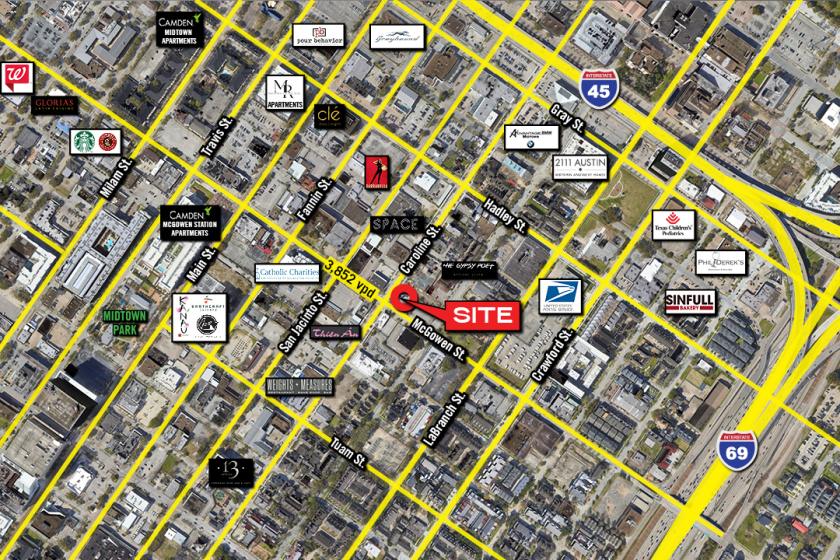
1-Mile | 3-Miles | 5-Miles | ||
---|---|---|---|---|
Total Population | 22,007 | 179,492 | 433,811 | |
Population Median Age | 35 | 36 | 37 | |
Population by Age | 0-9 Yrs | 1397 (6%) | 13570 (7%) | 45570 (10%) |
10-19 Yrs | 517 (2%) | 15179 (8%) | 39071 (9%) | |
20-29 Yrs | 8020 (36%) | 46636 (25%) | 92754 (21%) | |
30-39 Yrs | 5293 (24%) | 38202 (21%) | 82553 (19%) | |
40-49 Yrs | 2402 (10%) | 20683 (11%) | 52708 (12%) | |
50-59 Yrs | 2046 (9%) | 18703 (10%) | 47821 (11%) | |
60-69 Yrs | 1481 (6%) | 15515 (8%) | 41008 (9%) | |
70+ Yrs | 850 (3%) | 11003 (6%) | 32326 (7%) | |
Median HH Income | $82,124 | $79,134 | $71,868 | |
Total Household Income | < 24K | 2048 (15%) | 14817 (18%) | 37839 (19%) |
25-49K | 1844 (14%) | 11615 (14%) | 31782 (16%) | |
50-74K | 2100 (16%) | 12782 (15%) | 28757 (15%) | |
75-99K | 1829 (14%) | 9335 (11%) | 19604 (10%) | |
100-199K | 3329 (25%) | 19008 (23%) | 39715 (20%) | |
200K+ | 1878 (14%) | 13959 (17%) | 32566 (17%) | |
Highest Education Level | No Diploma | 571 | 11902 | 41755 |
Diploma or GED | 1413 | 16171 | 46626 | |
Some College | 2241 | 17794 | 40428 | |
Assoc. Degree | 809 | 5812 | 13319 | |
Bachelors Degree | 6896 | 41084 | 87401 | |
Higher Degree | 5252 | 37153 | 81293 | |
Total Housing Units | 15,257 | 94,269 | 218,064 | |
--Owner-Occupied | 3,394 | 31,006 | 82,744 | |
--Renter-Occupied | 9,634 | 50,510 | 107,519 | |
Owner-Occupied Values | < 100K | 195 | 1568 | 12077 |
100-199K | 350 | 4087 | 12628 | |
200-299K | 486 | 5040 | 9461 | |
300-399K | 1113 | 6132 | 11820 | |
400-499K | 484 | 3689 | 8549 | |
500K+ | 765 | 10490 | 28210 | |
Total Working Age Population | 20,308 | 159,255 | 366,665 | |
In Work Force | 16,619 | 106,883 | 243,708 | |
Not In Work Force | 3,688 | 52,372 | 122,957 | |
Workforce Employed | 15,944 | 101,139 | 230,760 | |
Workforce Unemployed | 668 | 5,627 | 12,730 | |
Civlian Workforce | 16,612 | 106,766 | 243,490 | |
Military Workforce | 7 | 117 | 219 | |
Total Households | 13,028 | 81,516 | 190,264 | |
Family Households | 3,352 | 31,825 | 89,539 | |
Non-Family Households | 9,675 | 49,690 | 100,725 | |
Married Couple | 2,457 | 23,453 | 64,208 | |
Other Family | 895 | 8,372 | 25,331 | |
Married w/Child | 403 | 6,829 | 22,550 | |
Single Male w/Child | 53 | 883 | 2,755 | |
Single Female w/Child | 332 | 2,577 | 8,240 |
Population Change Last Two Decades - Plus Projection
2000 | % | 2010 | % | 2020 | % | 2030 | |
---|---|---|---|---|---|---|---|
Texas | 20,851,820 | +21 | 25,145,561 | +18 | 29,677,668 | +18 | 34,894,452 |
Harris County | 3,400,578 | +20 | 4,092,459 | +22 | 4,978,845 | +19 | 5,924,750 |
Total Working Age Population:
Total Households:
Total Working Age Population:
Total Households:
Total Working Age Population:
Total Households: