Growing new development consisting of 2 bed/2 bath and 3 bed/2 bath townhomes
Each individual town home has its own PID - Property ID Number
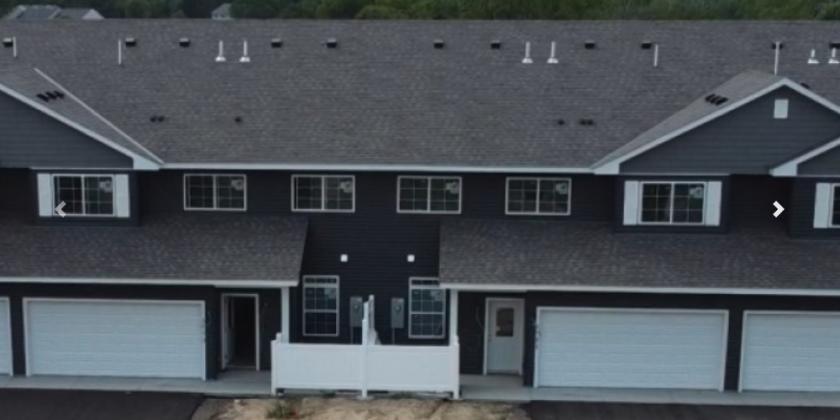
An 8-unit building has been completed with several homes already sold
Investor can purchase complete townhomes or ones in the pipeline
Welcome to Bridgewater Townhomes located in the City of Cambridge. A rising star in the State of Minnesota. Cambridge is situated along U.S. Route 65 and is located only 55 minutes from the heart of Downtown Minneapolis and 1 hour from Downtown St. Paul. Offering just the right mix of suburban life, Cambridge has the retailers, outings, airport and infrastructure needed to never have to leave the city.
Bridgewater Townhomes is a growing new development consisting of 2 bed / 2 bath and 3 bed / 2 bath townhomes. An 8-unit building has been completed with several homes already sold (Bridgewater Boulevard). Currently under construction is another 8-unit building with an expected completion date of November/December 2022. In addition to the current building under construction are plans for another 8-unit, a 6-unit and a 12-unit building. This is a prime investment opportunity for brand new homes in a great city. Each individual townhome has its own Property ID Number (PID). 3 bed / 2 bath are 1,172sf plus a 360 sf, 2-car garage (1,532 sf total). Interior units offer three bedrooms and a full bath on the upper level to include a laundry room. Walk-in closet in the master suite and walk-thru bath.
2 bed / 2 bath are 1,306sf plus a 360 sf, 2-car garage (1,666 sf total). These exterior units showcase vaulted ceilings and plenty of natural sun light. Main level has gas fireplace and 3/4 bath. Beautiful kitchen with granite counter top.
Addresses for the 8 unit currently under construction:
1730, 1752, 1772, 1796 Calhoun Court South
1729, 1751, 1773, 1795 Cleveland Court South
NOTE: Investor can purchase townhomes that are complete and in the pipeline as well
Completed: 8 units
Under Construction: 8 units
In the Pipeline: 8 units, 6 units, 12 units
No part of this information may be copied, reproduced, repurposed, or screen-captured for any commercial purpose without prior written authorization from MyEListing.
While we strive to provide the most accurate information, all listing information, and demographic data, is provided by third-parties. As such, MyEListing will not be responsible for the accuracy of the information. It is strongly recommended that you verify all information with the listing agent, and any relevant agencies, prior to making any decisions.
What is the building size of this Multifamily property in Cambridge, MN?
The size of the building/unit at 1796 Calhoun Ct S in Cambridge is 9,672 square feet
What is the population within 1 mile of 1796 Calhoun Ct S in Cambridge?
The population within 1 mile of 1796 Calhoun Ct S Cambridge, MN 55008 is 3,366 people.
Who do I contact for questions about 1796 Calhoun Ct S?
You should contact the listing agent,
Chris Missling, for any details regarding this commercial listing.