Retail Space
8417 Lyndale Avenue South Bloomington, MN 55420
8417 Lyndale Avenue South Bloomington, MN 55420
Details & Description
Property Highlights
- • Sublease through 03/25
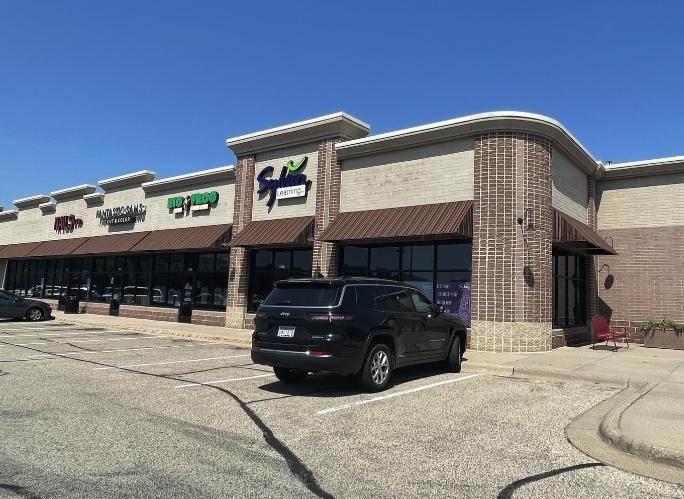
- • Corner Unit with Glass on Three Sides
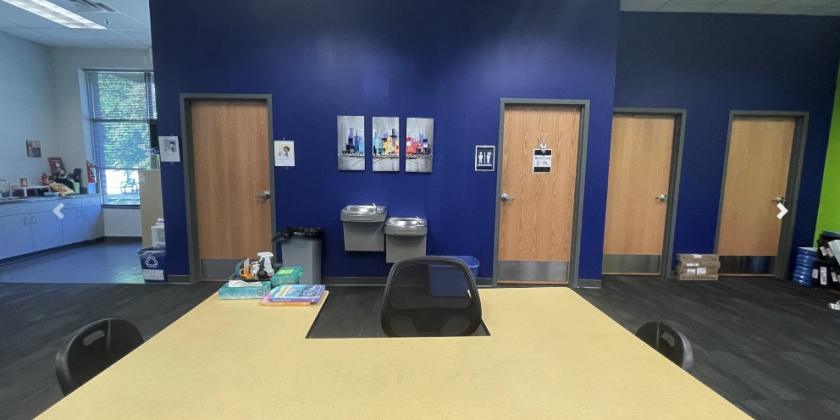
- • Well-Maintained Space
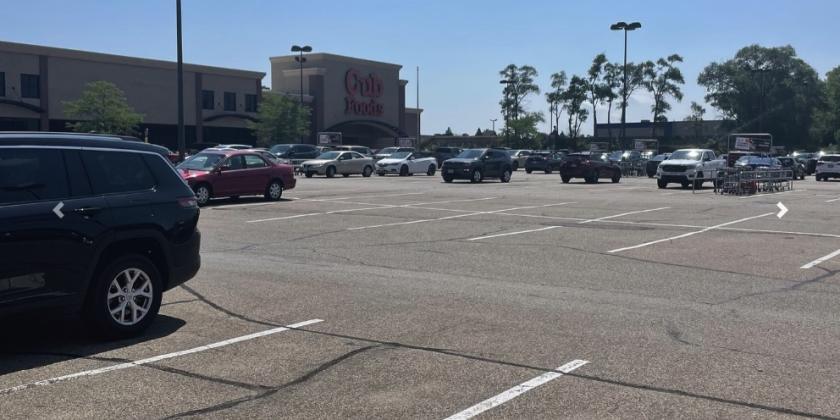
- • Thriving Commercial Corridor
- • 31 Months Remaining on Term
- • Garden/Park Behind Retail Strip
Additional Photos


Listing Agents

Michael Houge
O: 612-701-7454
M: 612-701-7454
michael@nailegacy.com
O: 612-701-7454
M: 612-701-7454
michael@nailegacy.com

Amelia Bjorklund
M: 952-491-3069
amelia@nailegacy.com
M: 952-491-3069
amelia@nailegacy.com
While we strive to provide the most accurate information, all listing information, and demographic data, is provided by third-parties. As such, MyEListing will not be responsible for the accuracy of the information. It is strongly recommended that you verify all information with the listing agent, and any relevant agencies, prior to making any decisions.