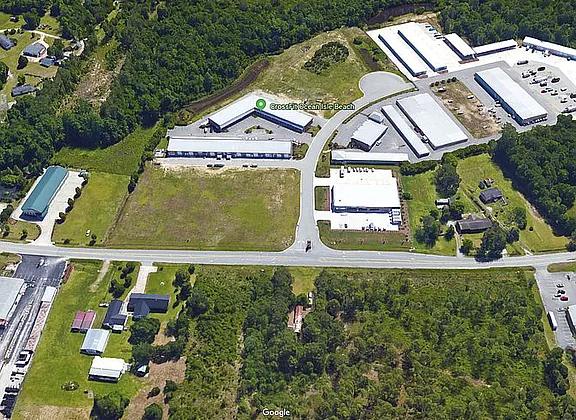
1-Mile | 3-Miles | 5-Miles | ||
---|---|---|---|---|
Total Population | 707 | 7,071 | 20,018 | |
Population Median Age | 63 | 58 | 55 | |
Population by Age | 0-9 Yrs | 8 (1%) | 291 (4%) | 1014 (5%) |
10-19 Yrs | 10 (1%) | 223 (3%) | 1102 (5%) | |
20-29 Yrs | 20 (2%) | 402 (5%) | 1411 (7%) | |
30-39 Yrs | 37 (5%) | 452 (6%) | 1241 (6%) | |
40-49 Yrs | 35 (4%) | 535 (7%) | 1370 (6%) | |
50-59 Yrs | 70 (9%) | 975 (13%) | 3165 (15%) | |
60-69 Yrs | 282 (39%) | 2042 (28%) | 5122 (25%) | |
70+ Yrs | 246 (34%) | 2152 (30%) | 5593 (27%) | |
Median HH Income | $91,600 | $75,668 | $67,600 | |
Total Household Income | < 24K | 39 (11%) | 616 (17%) | 1541 (16%) |
25-49K | 39 (11%) | 538 (15%) | 1907 (20%) | |
50-74K | 59 (16%) | 550 (16%) | 1694 (18%) | |
75-99K | 61 (17%) | 495 (14%) | 1587 (16%) | |
100-199K | 102 (28%) | 982 (28%) | 2214 (23%) | |
200K+ | 55 (15%) | 254 (7%) | 449 (4%) | |
Highest Education Level | No Diploma | 6 | 172 | 874 |
Diploma or GED | 120 | 1664 | 4637 | |
Some College | 137 | 1257 | 3803 | |
Assoc. Degree | 73 | 618 | 1709 | |
Bachelors Degree | 243 | 1763 | 3864 | |
Higher Degree | 98 | 865 | 2127 | |
Total Housing Units | 484 | 6,226 | 18,126 | |
--Owner-Occupied | 306 | 2,908 | 8,038 | |
--Renter-Occupied | 48 | 526 | 1,356 | |
Owner-Occupied Values | < 100K | 1 | 303 | 956 |
100-199K | 39 | 556 | 2231 | |
200-299K | 57 | 524 | 1948 | |
300-399K | 36 | 543 | 1189 | |
400-499K | 37 | 400 | 702 | |
500K+ | 137 | 583 | 1012 | |
Total Working Age Population | 693 | 6,698 | 18,465 | |
In Work Force | 153 | 2,370 | 7,072 | |
Not In Work Force | 540 | 4,329 | 11,393 | |
Workforce Employed | 126 | 2,172 | 6,644 | |
Workforce Unemployed | 27 | 198 | 412 | |
Civlian Workforce | 153 | 2,370 | 7,056 | |
Military Workforce | 0 | 0 | 16 | |
Total Households | 354 | 3,434 | 9,394 | |
Family Households | 290 | 2,397 | 6,458 | |
Non-Family Households | 64 | 1,036 | 2,935 | |
Married Couple | 282 | 2,207 | 5,636 | |
Other Family | 8 | 191 | 822 | |
Married w/Child | 7 | 153 | 569 | |
Single Male w/Child | 0 | 0 | 20 | |
Single Female w/Child | 0 | 30 | 163 |
Population Change Last Two Decades - Plus Projection
2000 | % | 2010 | % | 2020 | % | 2030 | |
---|---|---|---|---|---|---|---|
North Carolina | 8,049,313 | +18 | 9,535,483 | +11 | 10,630,691 | +11 | 11,836,070 |
Brunswick County | 73,143 | +47 | 107,431 | +36 | 146,135 | +23 | 179,854 |
Total Working Age Population:
Total Households:
Total Working Age Population:
Total Households:
Total Working Age Population:
Total Households: