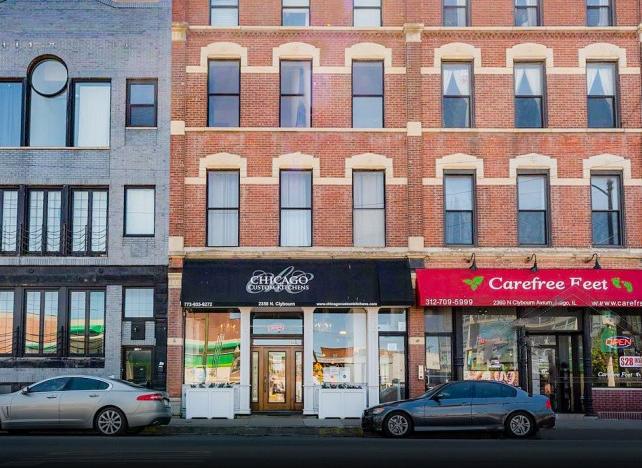
1-Mile | 3-Miles | 5-Miles | ||
---|---|---|---|---|
Total Population | 55,307 | 543,575 | 1,146,422 | |
Population Median Age | 33 | 35 | 36 | |
Population by Age | 0-9 Yrs | 6579 (11%) | 51232 (9%) | 117376 (10%) |
10-19 Yrs | 5393 (9%) | 36139 (6%) | 98902 (8%) | |
20-29 Yrs | 14318 (25%) | 140282 (25%) | 252493 (22%) | |
30-39 Yrs | 12586 (22%) | 132666 (24%) | 249105 (21%) | |
40-49 Yrs | 6446 (11%) | 64191 (11%) | 141478 (12%) | |
50-59 Yrs | 4747 (8%) | 49308 (9%) | 118136 (10%) | |
60-69 Yrs | 2935 (5%) | 37785 (6%) | 93230 (8%) | |
70+ Yrs | 2304 (4%) | 31973 (5%) | 75702 (6%) | |
Median HH Income | $149,001 | $95,828 | $81,091 | |
Total Household Income | < 24K | 1999 (8%) | 33631 (12%) | 85090 (16%) |
25-49K | 1525 (6%) | 31966 (12%) | 78613 (15%) | |
50-74K | 1890 (8%) | 37434 (14%) | 74885 (14%) | |
75-99K | 2000 (8%) | 32063 (12%) | 60209 (11%) | |
100-199K | 6837 (30%) | 73382 (28%) | 130132 (25%) | |
200K+ | 8152 (36%) | 51017 (19%) | 77593 (15%) | |
Highest Education Level | No Diploma | 944 | 23271 | 87385 |
Diploma or GED | 2355 | 40093 | 120140 | |
Some College | 2633 | 41800 | 104850 | |
Assoc. Degree | 822 | 15115 | 36711 | |
Bachelors Degree | 17544 | 170618 | 281953 | |
Higher Degree | 13680 | 120825 | 207564 | |
Total Housing Units | 25,064 | 286,447 | 564,779 | |
--Owner-Occupied | 11,807 | 104,976 | 203,270 | |
--Renter-Occupied | 10,596 | 154,517 | 303,253 | |
Owner-Occupied Values | < 100K | 177 | 1935 | 7461 |
100-199K | 106 | 7204 | 22629 | |
200-299K | 514 | 15130 | 40346 | |
300-399K | 1123 | 17558 | 37317 | |
400-499K | 1743 | 15663 | 27024 | |
500K+ | 8143 | 47485 | 68493 | |
Total Working Age Population | 46,174 | 470,793 | 971,761 | |
In Work Force | 36,641 | 375,134 | 721,009 | |
Not In Work Force | 9,533 | 95,658 | 250,752 | |
Workforce Employed | 35,661 | 361,907 | 683,801 | |
Workforce Unemployed | 967 | 13,121 | 36,860 | |
Civlian Workforce | 36,628 | 375,027 | 720,662 | |
Military Workforce | 13 | 107 | 348 | |
Total Households | 22,403 | 259,493 | 506,522 | |
Family Households | 10,693 | 100,545 | 225,867 | |
Non-Family Households | 11,710 | 158,948 | 280,656 | |
Married Couple | 9,230 | 78,906 | 160,613 | |
Other Family | 1,462 | 21,639 | 65,253 | |
Married w/Child | 4,554 | 31,460 | 62,185 | |
Single Male w/Child | 280 | 2,684 | 6,736 | |
Single Female w/Child | 415 | 6,868 | 22,010 |
Population Change Last Two Decades - Plus Projection
2000 | % | 2010 | % | 2020 | % | 2030 | |
---|---|---|---|---|---|---|---|
Illinois | 12,419,293 | +3 | 12,830,632 | +12 | 14,316,487 | +6 | 15,138,849 |
Cook County | 5,376,741 | -3 | 5,194,675 | +10 | 5,707,832 | +5 | 5,990,243 |
Total Working Age Population:
Total Households:
Total Working Age Population:
Total Households:
Total Working Age Population:
Total Households: